Quickstart
Let’s have a quick round trip see what smartLog offers.
After we have installed smartLog, it can be used out of the box without any further set up needed. Although, there are several things offered to customize as we will explore later.
Whenever we save or load a working file, time will now be tracked to it. Let’s open any working file and keep working in it.
Launching the main window
At any time, we can launch smartLog and see the time logs. Hit Alt + L or
navigate to cragl -> smartLog -> smartLog to launch smartLog. This is how the
main window looks like:
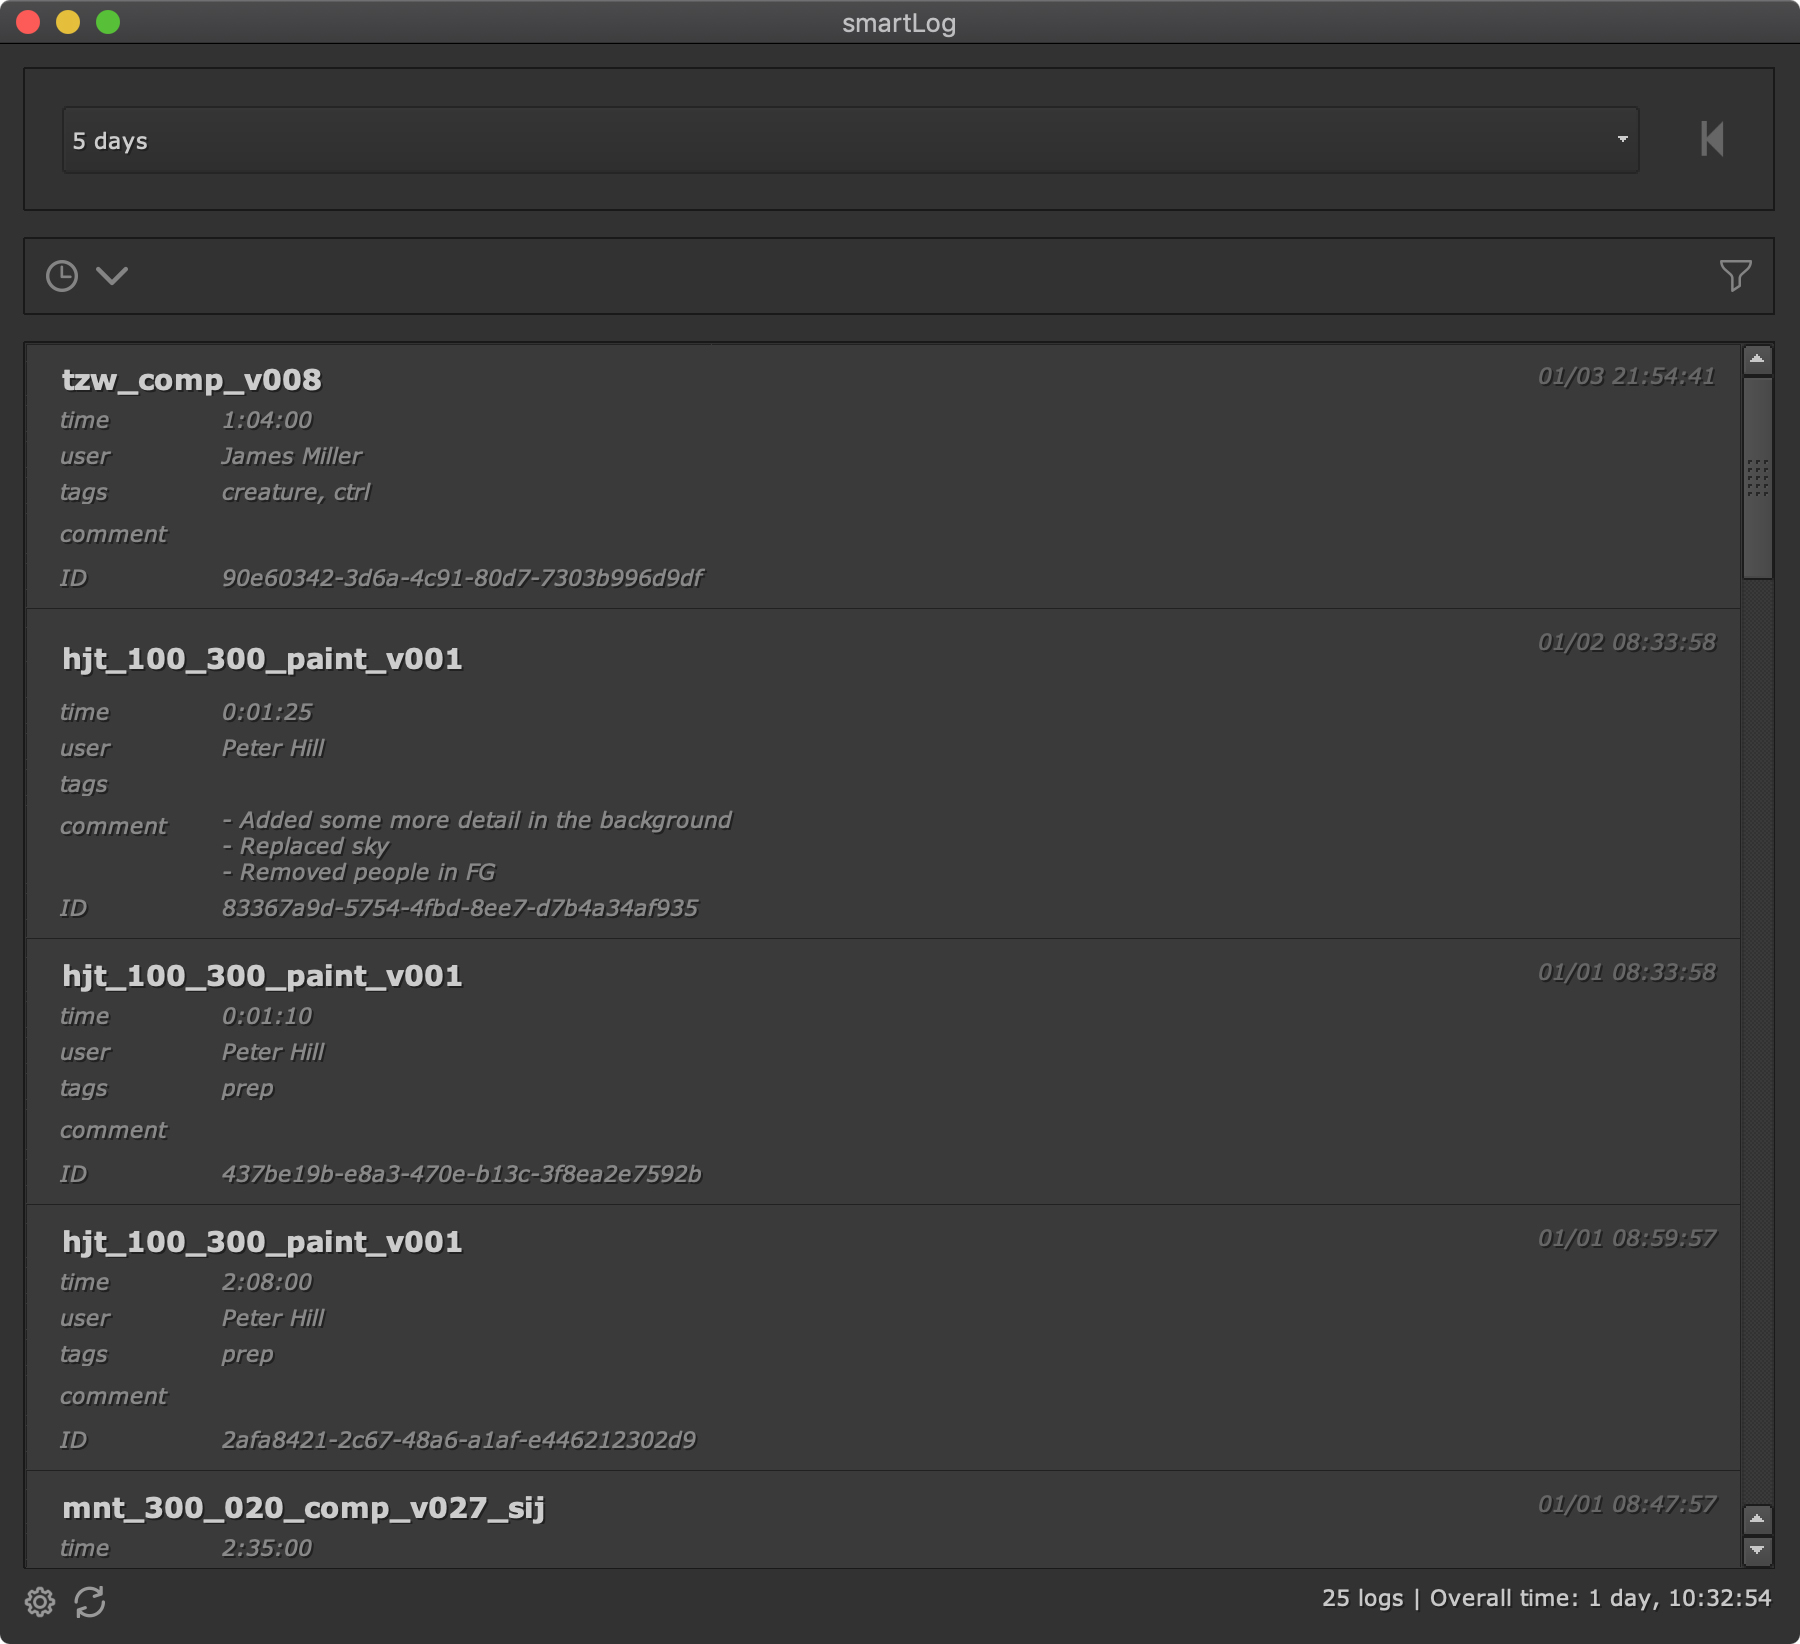
smartLog contains three viewing modes:
- History viewing mode
- Time ranking viewing mode
- Pie viewing mode
History mode
By default, we are in history mode. This mode shows a chronological list of time logs being sorted by creation time in descending order. Each time we load or save a working file, the time tracker gets active and logs time for the currently open working file. Logs get automatically stopped when Nuke gets idle. By default, the idle time is set to 30 seconds, but it can be adjusted as needed.
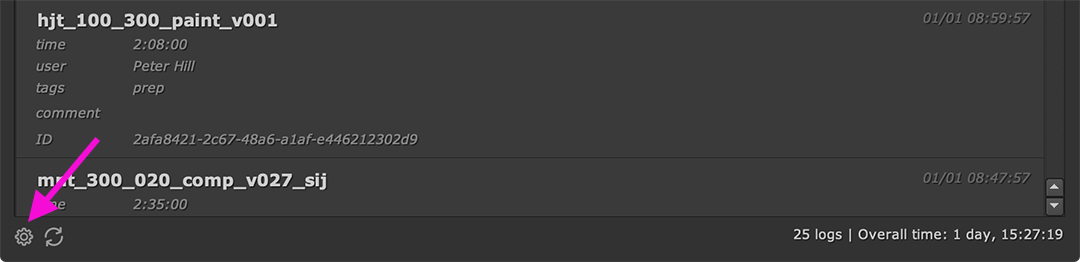
This is how a time log gets displayed in history mode:
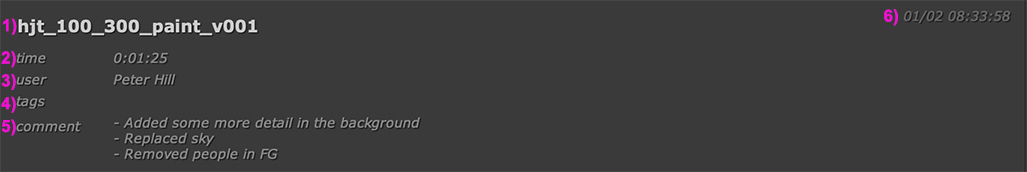
Each time log contains the following details:
- 1) Working file name: The name of the working file.
- 2) Time: The time that the user spent on in hours, minutes and seconds.
- 3) User: The user that worked on the working file.
- 4) Tags: Tags that the time log can be associated with for filtering.
- 5) Comment: Any comments about the time log and the working file.
- 6) Date/ Time: The date and time the time log was created at.
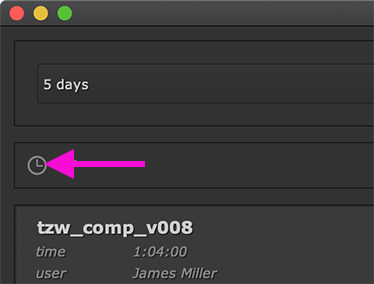
We can click the viewing mode toggle at the top left to toggle between different viewing modes.
Time ranking mode
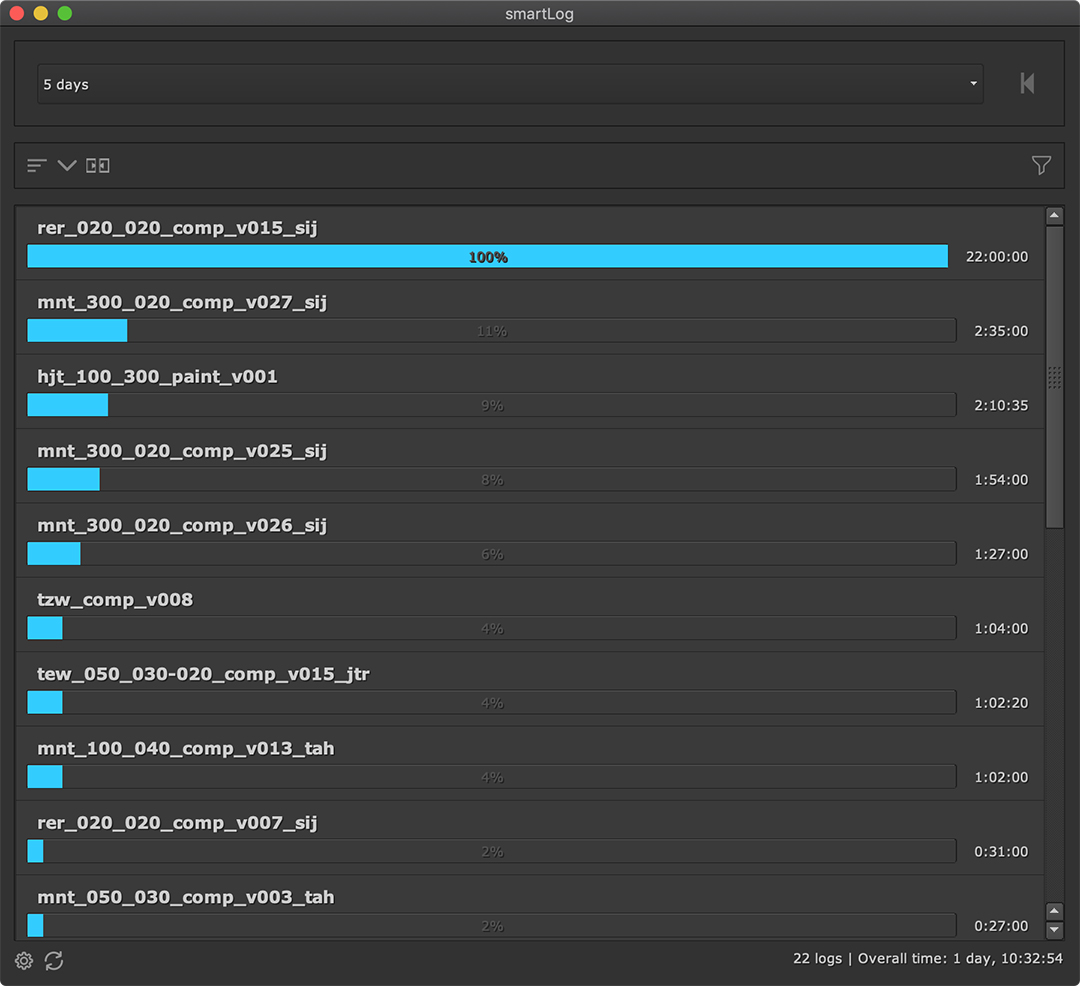
Clicking the viewing mode button once switches to time ranking viewing mode:
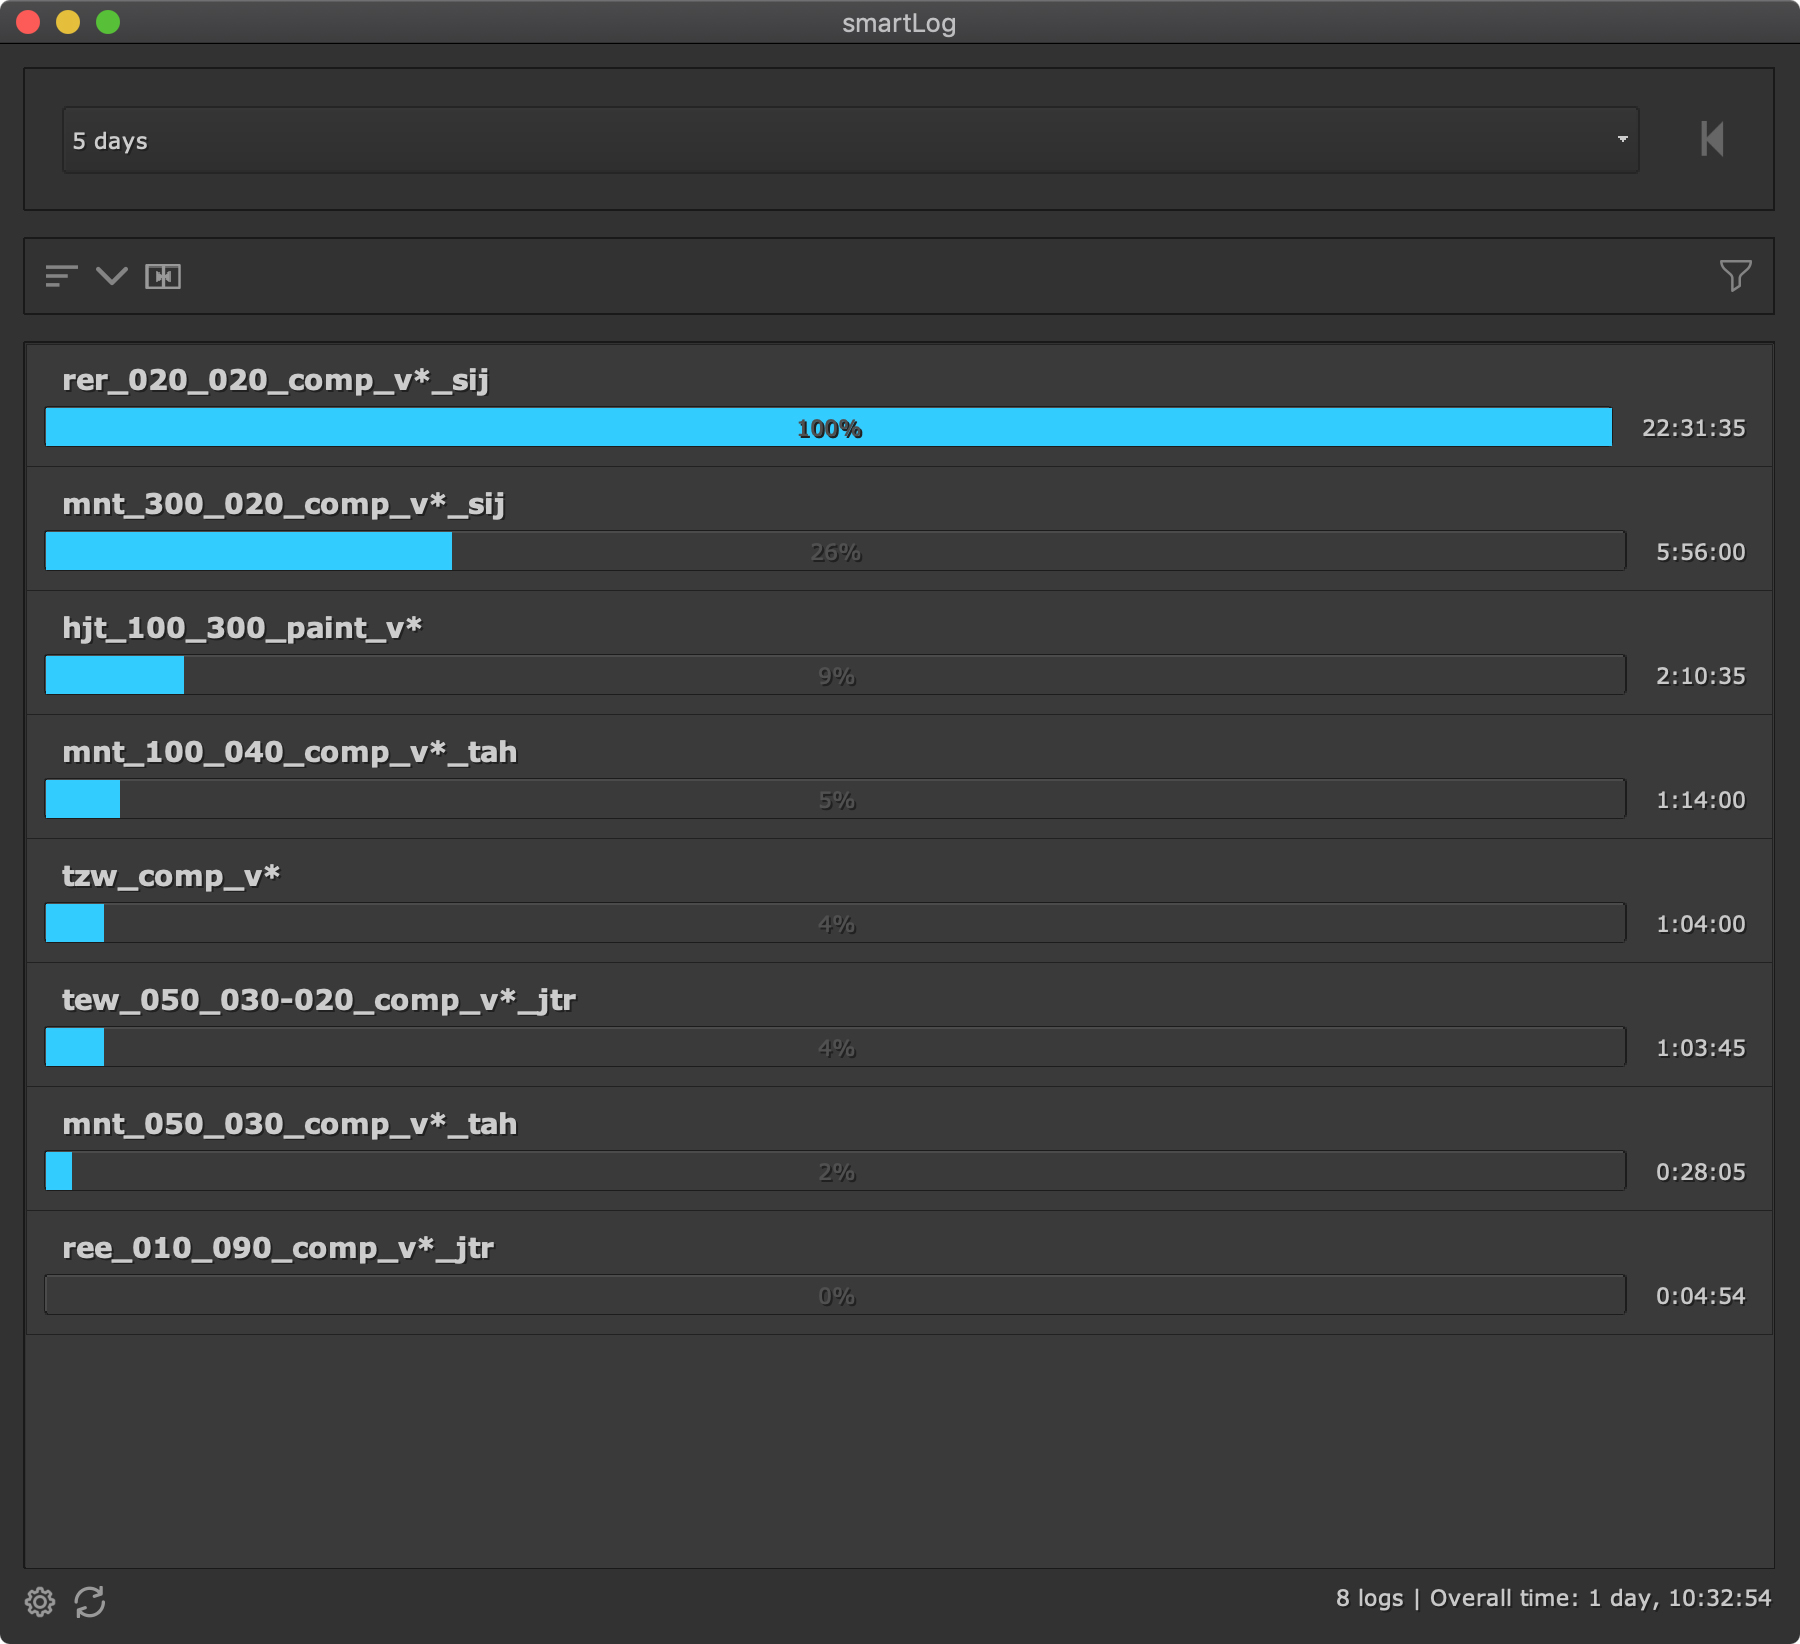
This mode gives us an overview of the amount of time being spend compared to other working files.
By default, time logs of the same working files of different versions are merged. So this gives us an overview of the total time spent on a task without to take any version number into account. However, we can explicitly show the logs unmerged, so that we see time being spend on every version. For that, click the merge toggle at the top:
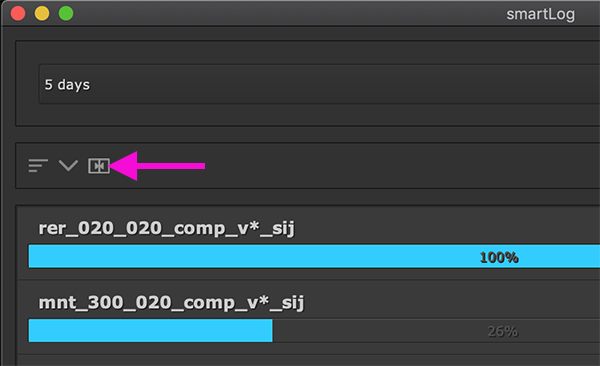
The time logs are now unmerged in version so that we can see how much time we spend on every version:
Pie view mode
Let’s switch to the third viewing mode which is the pie view mode. Click the viewing mode at the top left one more time.
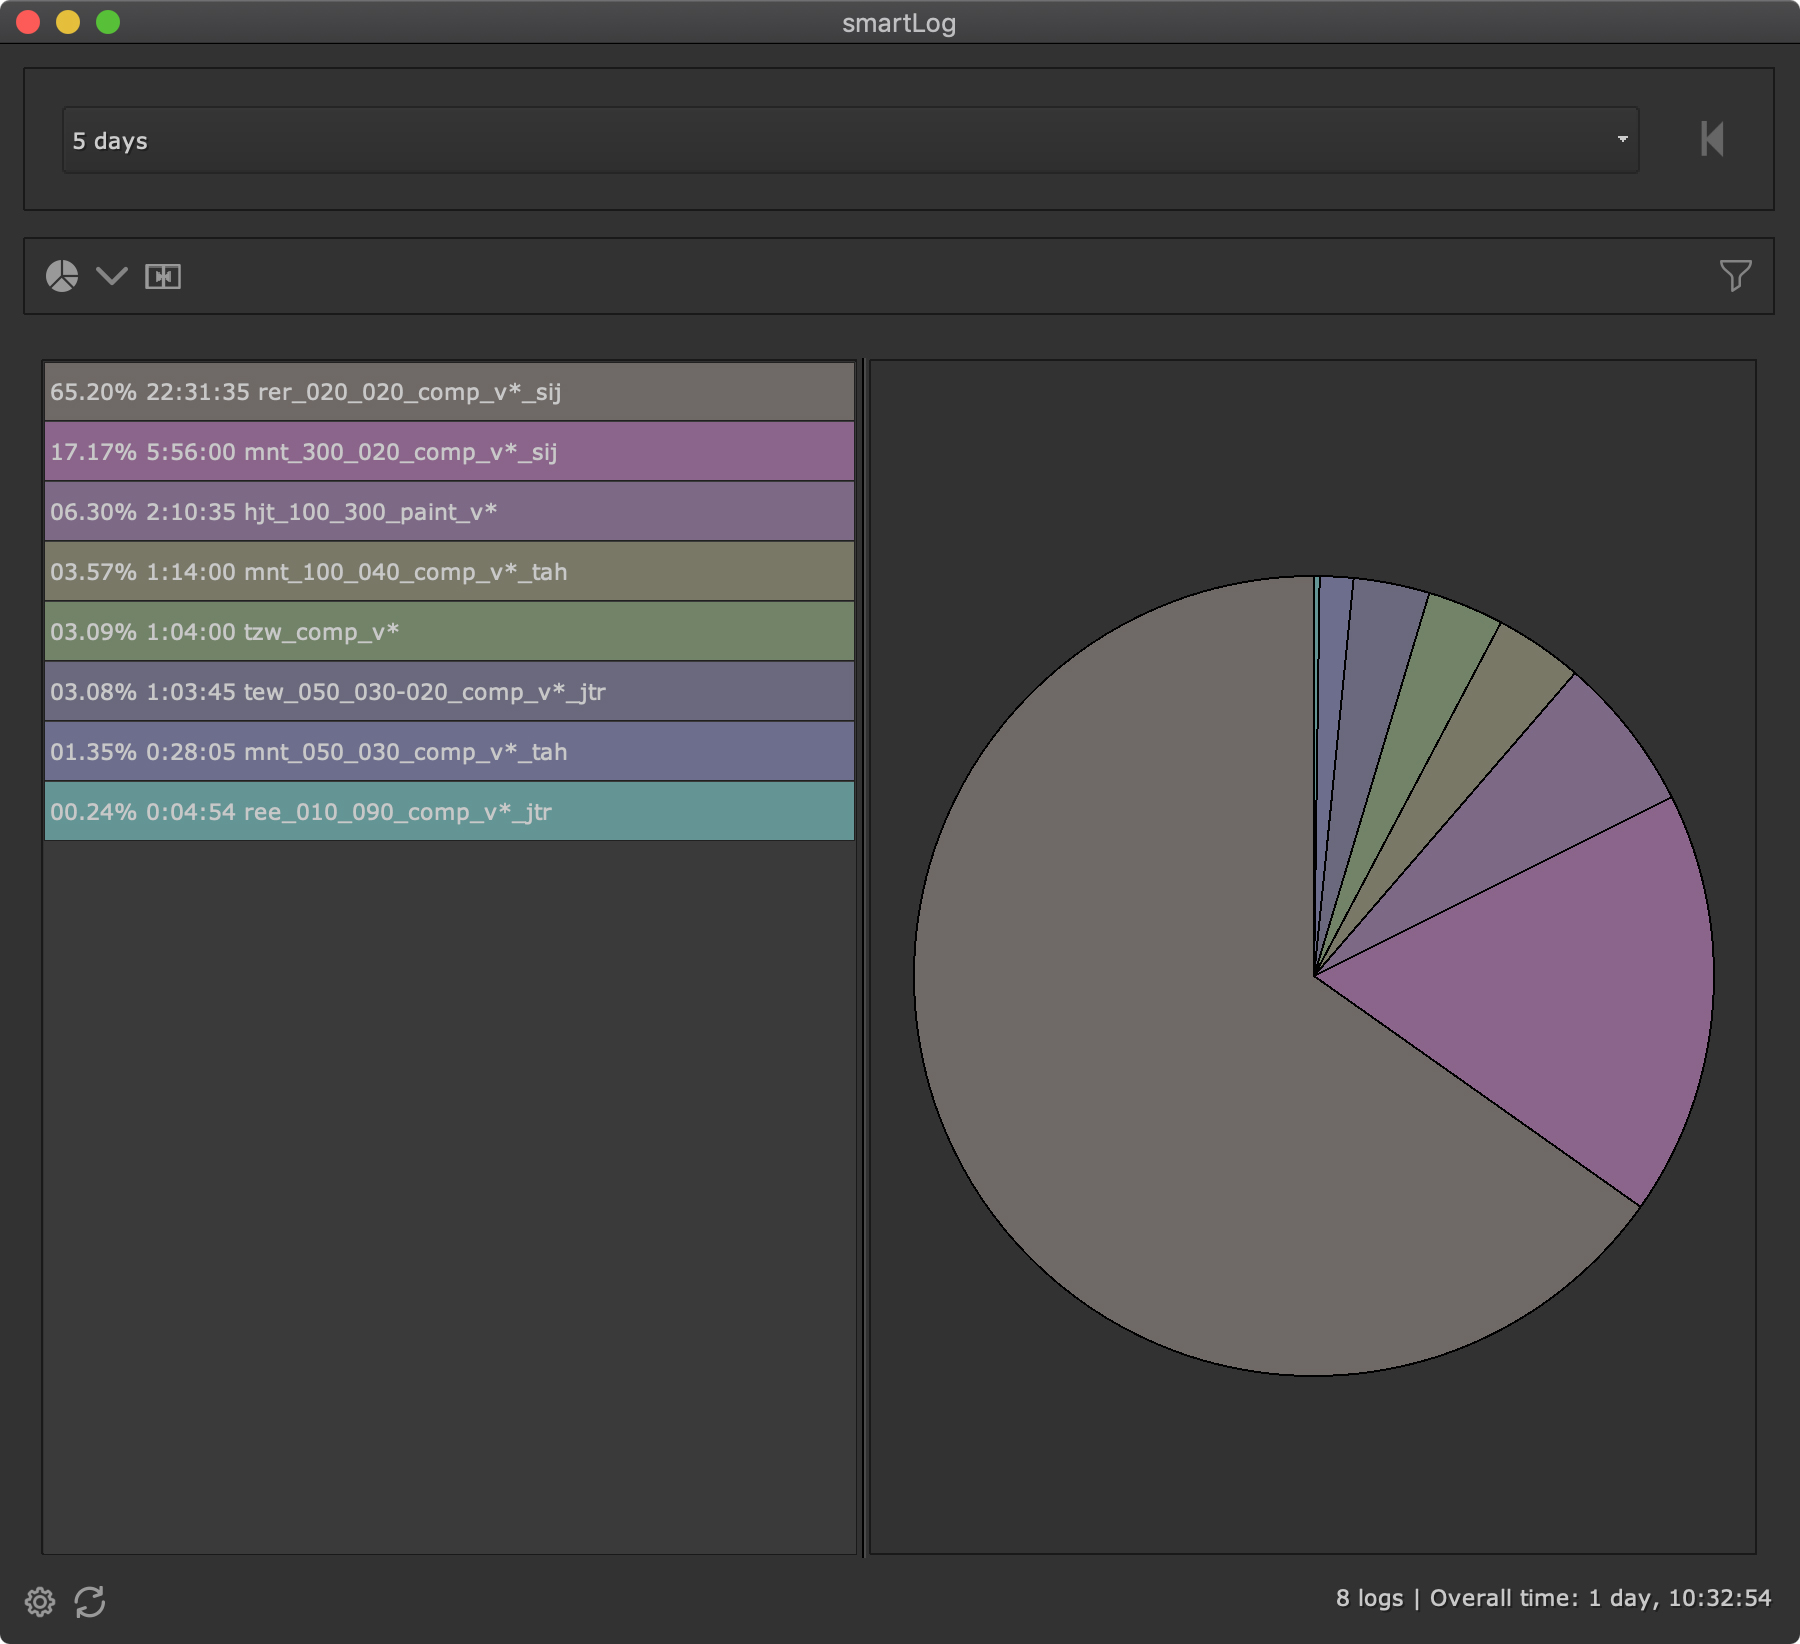
This viewing mode shows a pie diagram that displays the time being spend compared to other working files. This mode contains a merged and unmerged mode too, so we can see the overall time that was spent on a task and time that was spent on individual versions.
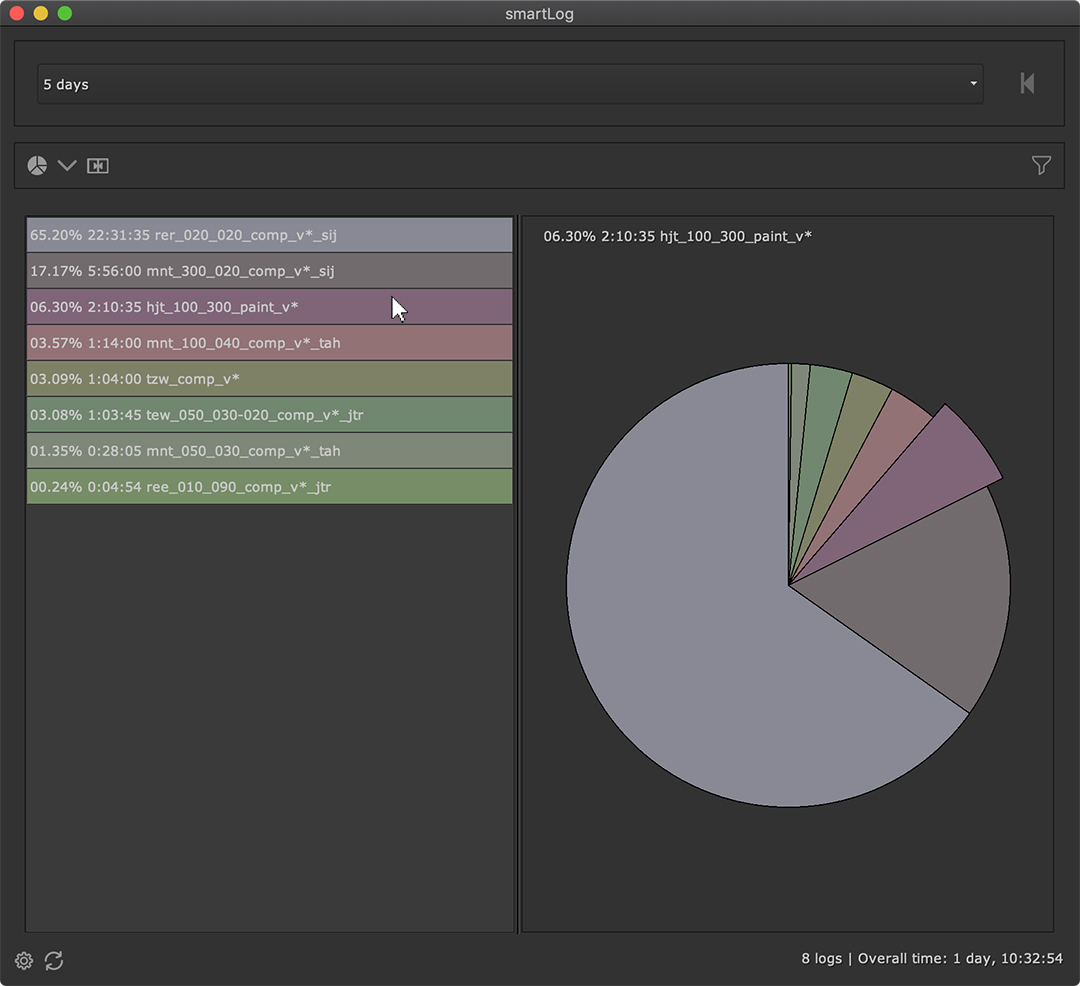
By hovering over one of the rows of the table on the left, the associated pie section gets enlarged for easier viewing:
Time range modes
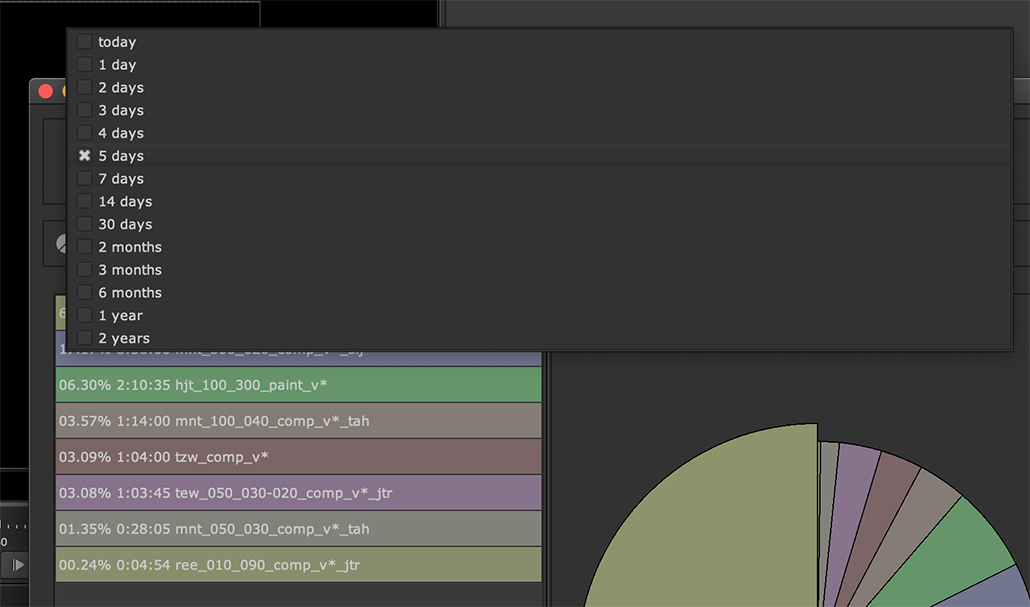
In all three viewing modes we have three options to limit the time range that we want to see logs for. At the moment, we are in the latest count mode.
Here, we can use the drop down menu to view only time logs that were created today, within the last two days, three days, one week, one month, and so on:
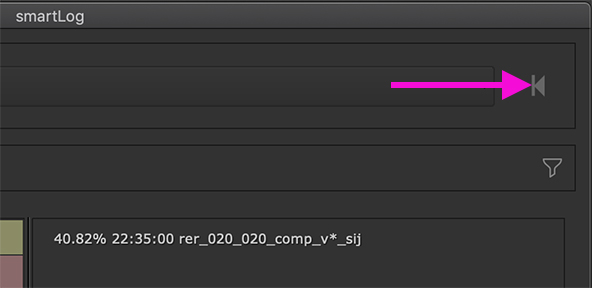
Let’s click the time mode button at the top right to toggle to the next time mode:
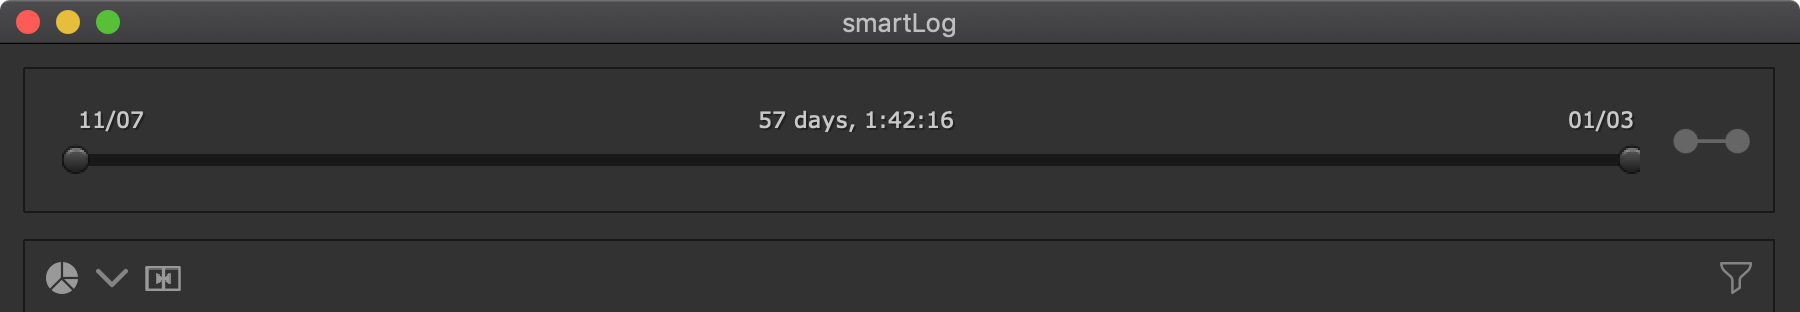
The next mode lets us choose a time range. On the left we an set the oldest date that we want to see time logs for. On the right we can set the latest date that we want to see time logs for:
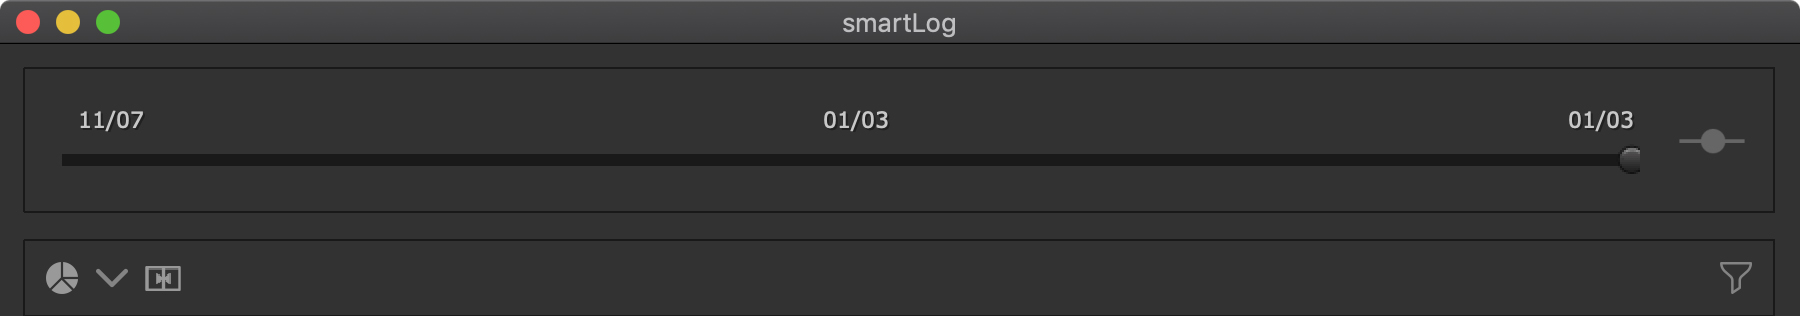
Let’s click the time mode toggle one more time. We will now have a one range slider which we can use to see time logs for one specific day.
Setting a timer
smartLog offers a timer that we can set to any custom interval. It will automatically show a notification after it timed out and play a configurable sound.
Let’s concentrate working on our comp for 60 minutes without getting interrupted (hopefully) by setting a timer.
To launch the timer navigate to cragl -> smartLog -> Timer or use the hotkey
Alt + T. The timer launches:
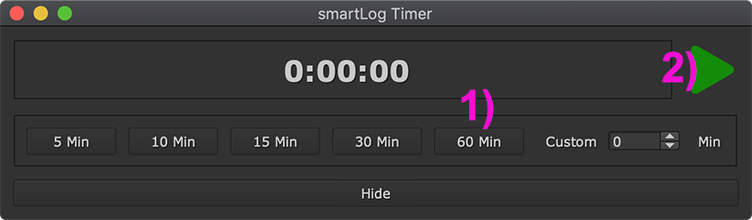
To set the timer to 60 minutes click the 60 Min button (1). You can shift click a button to add additional time to it. Let’s do a simple click without shift being hold to go back to 60 minutes. If you are ready, click the play button (2). The timer will now count backwards from 60 minutes:
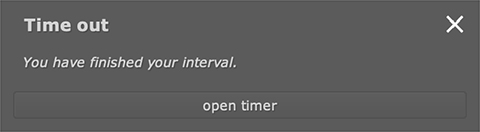
Once the timer has timed out after 1 hour, a notification will show up at the bottom right:
In addition, a sound will be played. This sound is adjustable and can be configured in smartLog’s settings section. And you can even use your own sounds by dropping a .wav file into smartLog’s sounds folder.
Day rate calculator
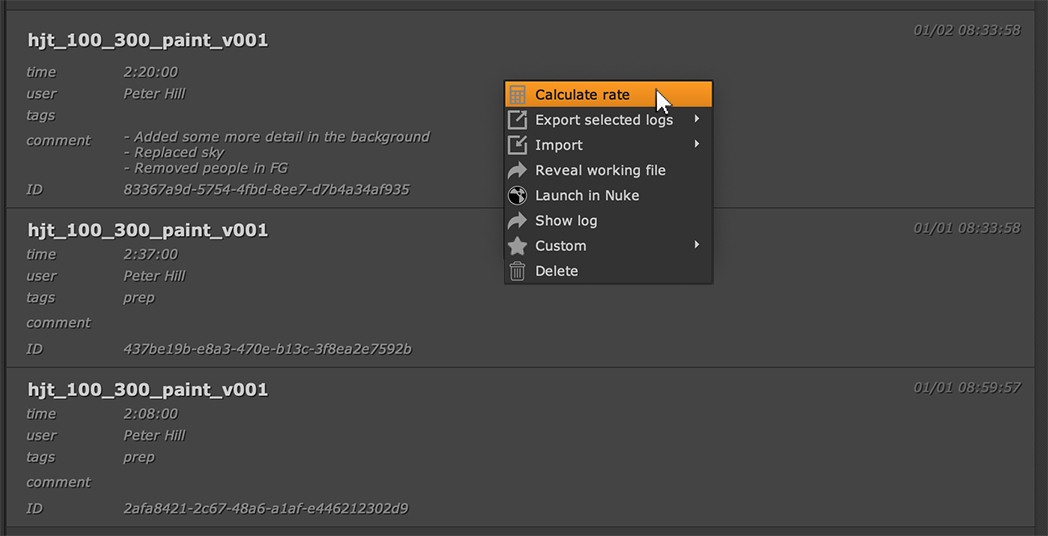
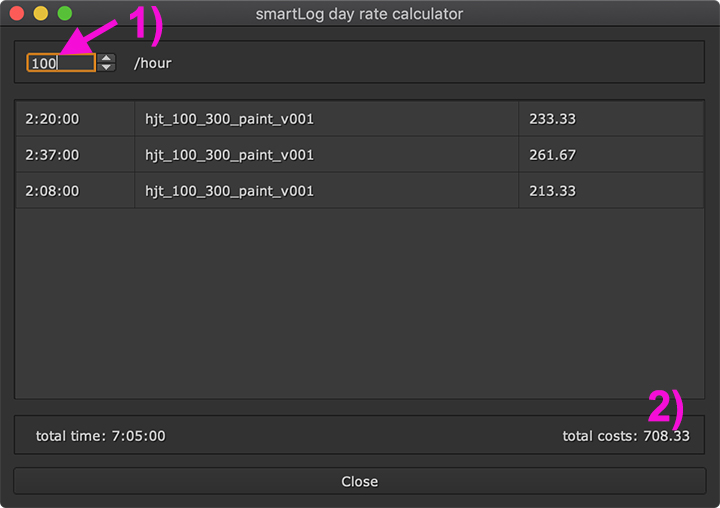
After a long day of work, let’s see how much we earned. For that, smartLog offers a day rate calculator. Select the time logs to calculate the day rates for. Right click and choose Day rate:
The upcoming day rate calculator gets populated with the selected time logs. At the top left we can enter the amount to earn per hour (1). Each row represents a selected log. The first column shows the time being spent on the working file. The next column shows the working file name. Hover over it to get the absolute path as a tooltip. The third column shows the amount you earned depending on the amount per hour set at the top left. At the bottom left we see the total amount of time spent on all selected time logs. At the bottom right we see the total amount we earned for the selected time logs.
Exporting time logs
After our project has finished we are ready to archive the time logs for our show. Let’s filter all time logs for our show hjt. Click the filter button at the top right:
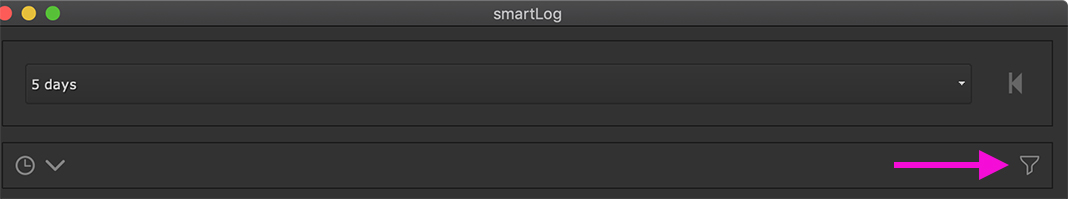
This reveals the filter section to filter logs that match certain criteria.
Let’s set the filter to path, contains, hjt.
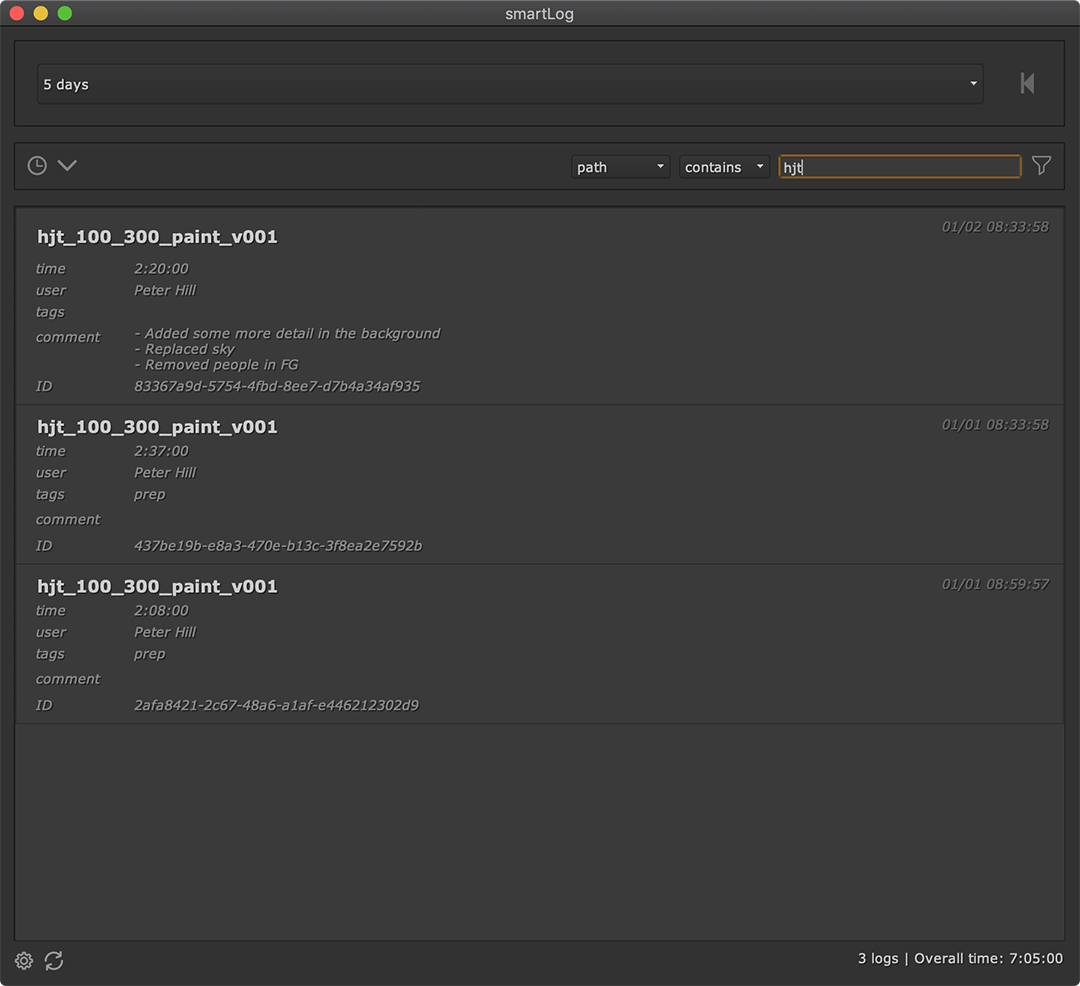
We can also filter by user, comment, tags, etc, but matching a keyword in the
path of our working files is all we want. This will now display only time logs
of this show. As all shots of that show are located in a project specific
folder on our server we could have also simpy entered the project root
directory, but entering just hjt works fine in this example.
At the bottom right we see that this filter results in having 3 logs and an overall time of 5 hours and 5 minutes.
Select all three logs, right click and choose Export selected logs.
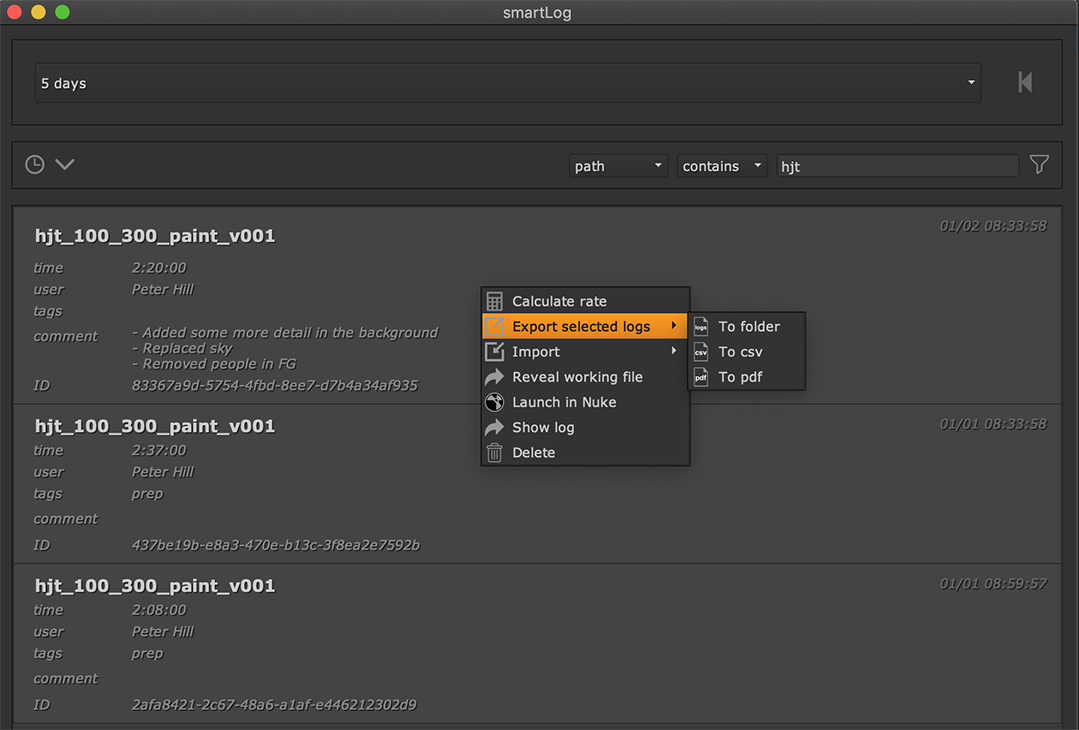
smartLog offers several export formats:
- To folder: Export the time logs as json file format to a folder
- To csv: Export the time logs to csv
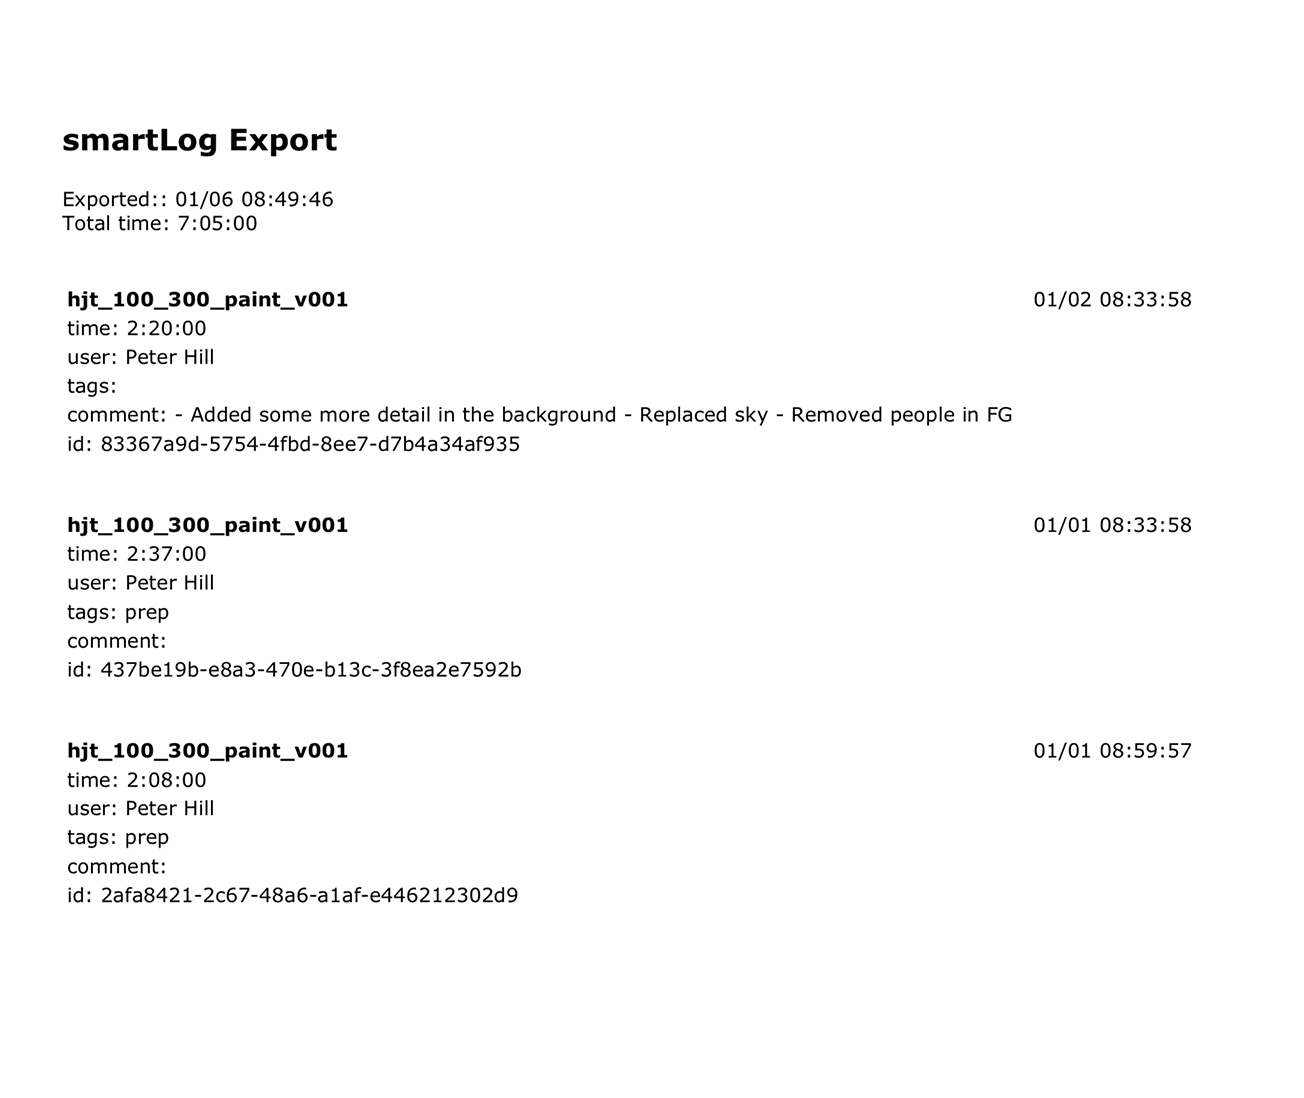
- To pdf: Export the time logs to pdf
Choose To csv. In the upcoming path browser choose a path to save the csv file to. The time logs get exported to the defined location:

Let’s also export the time logs as pdf so that we can send this information to our producer. Select To pdf and choose a location. The pdf gets created to the defined location:
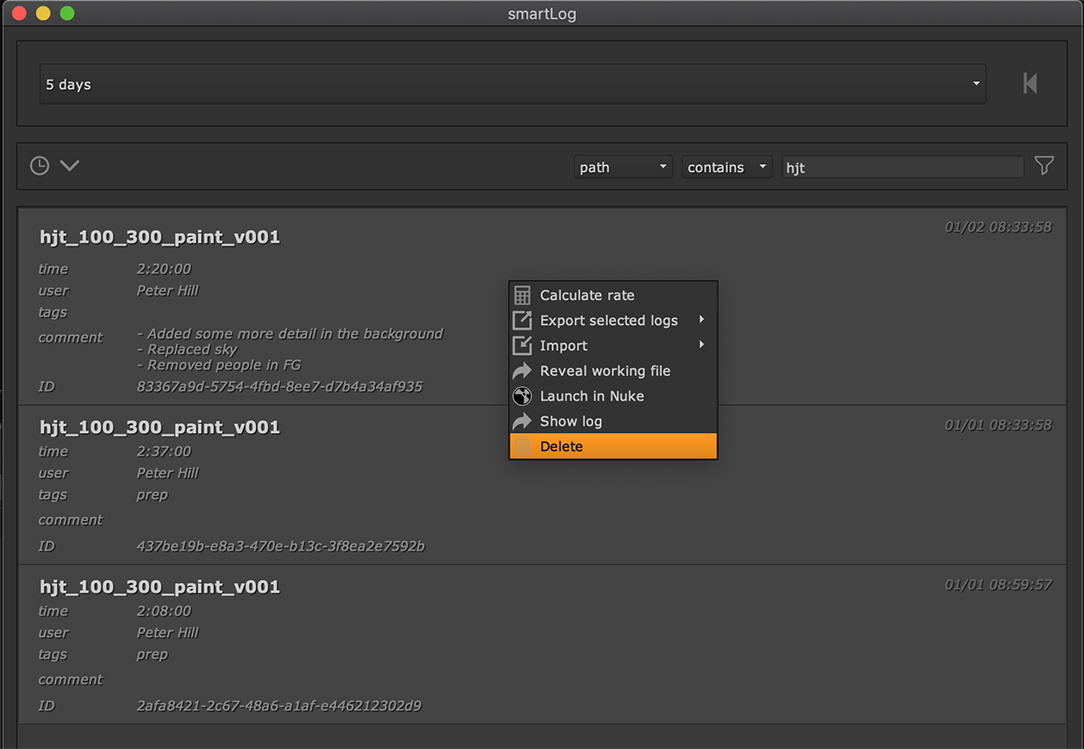
We can now remove the time logs from smartLog. Right click the selected time logs and choose Delete from the context menu:
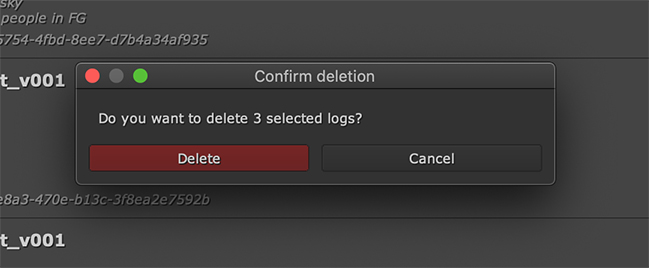
Confirm the deletion and the time logs get removed.
Importing time logs
In case we ever want to bring the time logs back, we can do so by importing them back into smartLog. For that, right click and choose import:
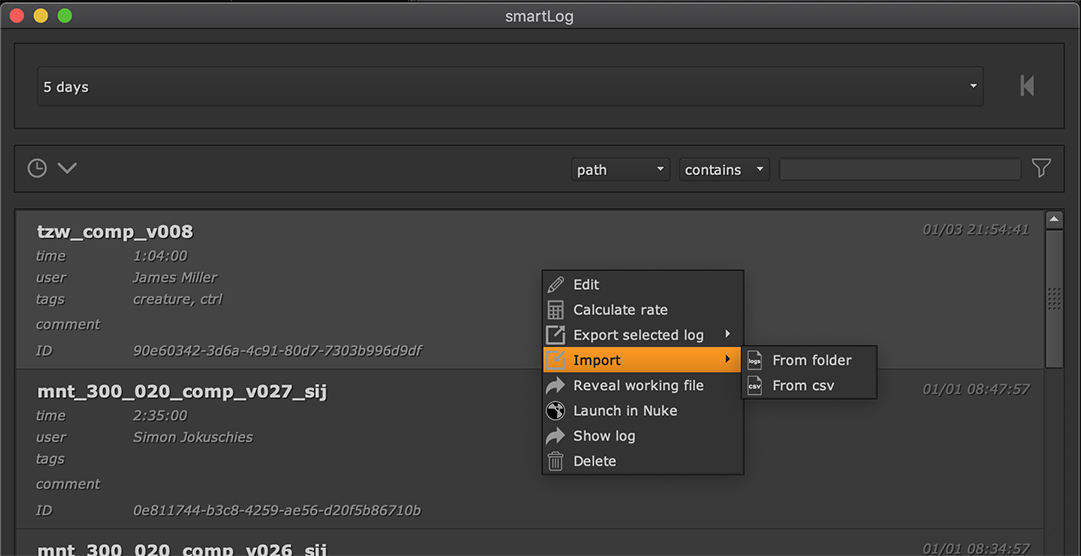
From here we have the option to import from a folder. This will import all time log .json files from one specific path that we browsed to. As we have exported our time logs to csv, let’s click the from csv command, browse to our exported csv file and click open. The time logs get imported back into smartLog.
Settings
Let’s finally have a quick look at smartLog’s settings. For that, click the settings button at the bottom left.
The settings contains several elements:
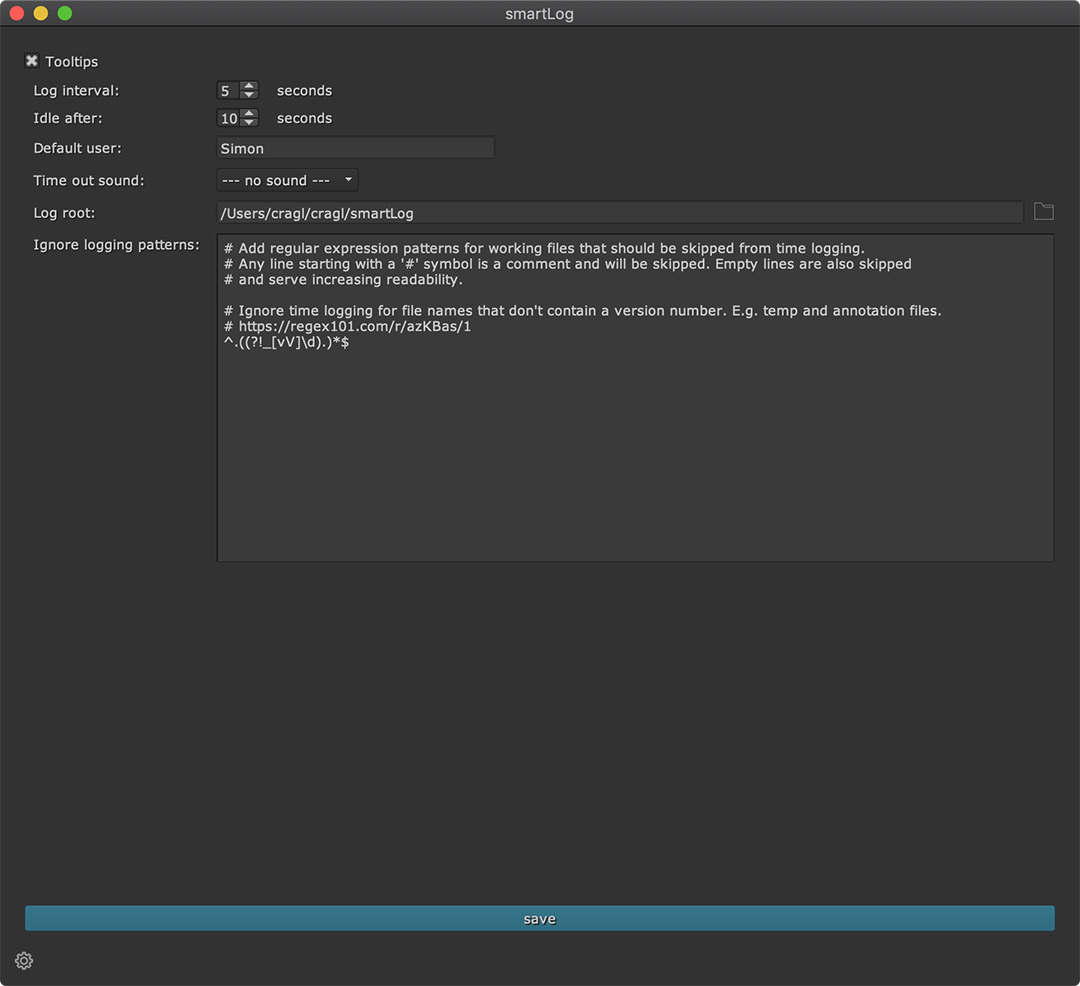
There are several things to customize here. All offered settings get described in more detail in the settings section. Let’s have a quick tour of how to set the time logs root and learn about ignoring certain working files.
smartLog stores all time logs as .json files in a dedicated folder. By default it is located in:
<user home directory>/cragl/smartLog
You can however point the logs directory to anywhere else. For instance, you can locate it to a cloud or server that several other machines and/ or users have access to. With that you can write time logs for several users into one directory which makes getting information about who worked on which shots for how long more transparent.