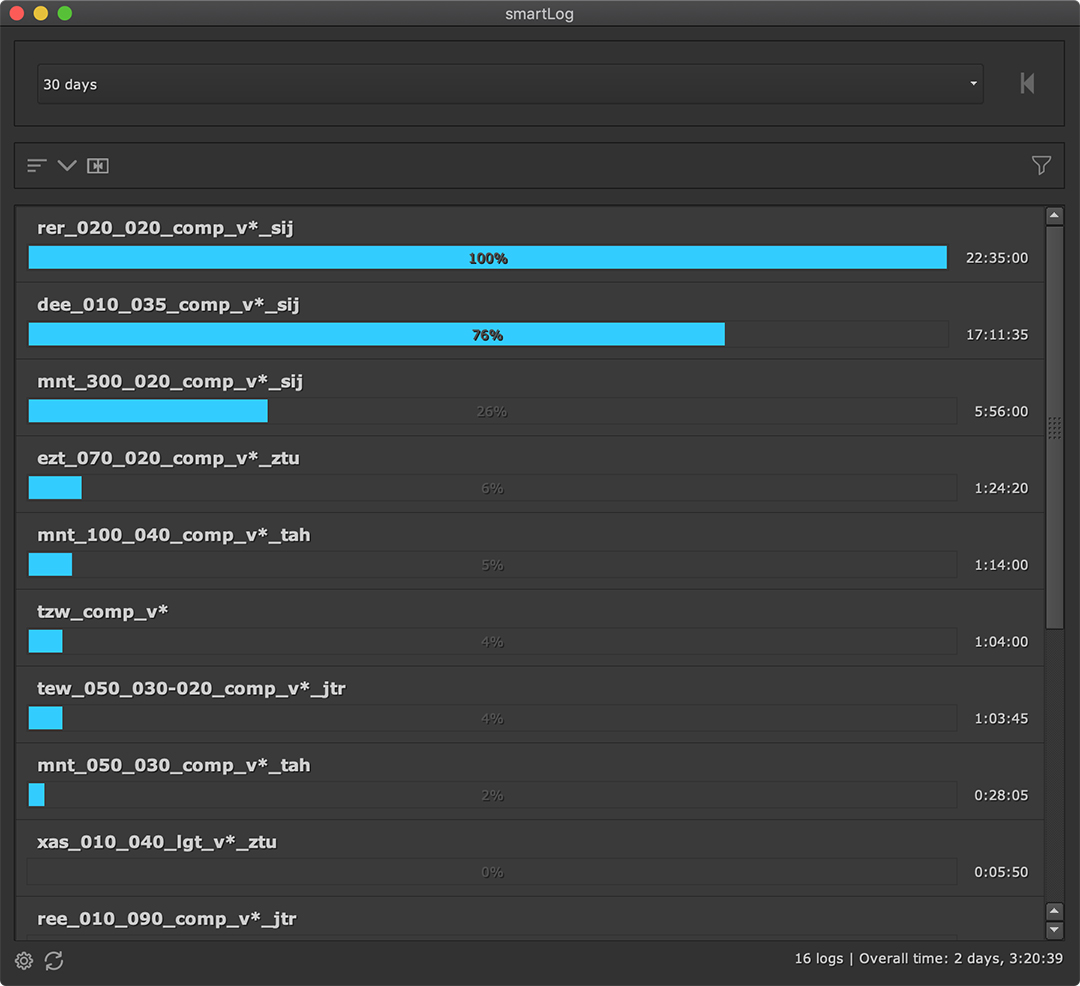
Main Window
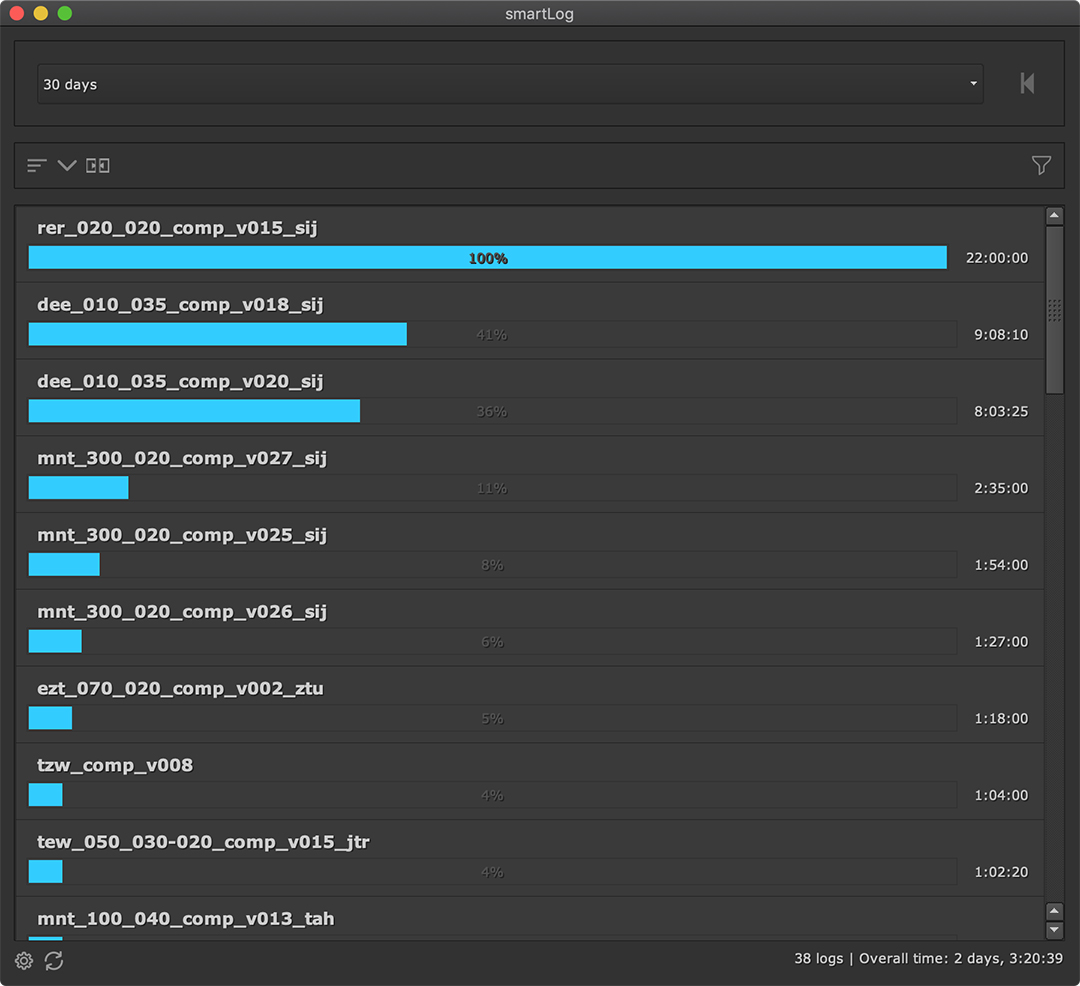
The main window lets you view time logs in different viewing modes using a custom time range. When launching smartLog the first time, it is set to history mode:
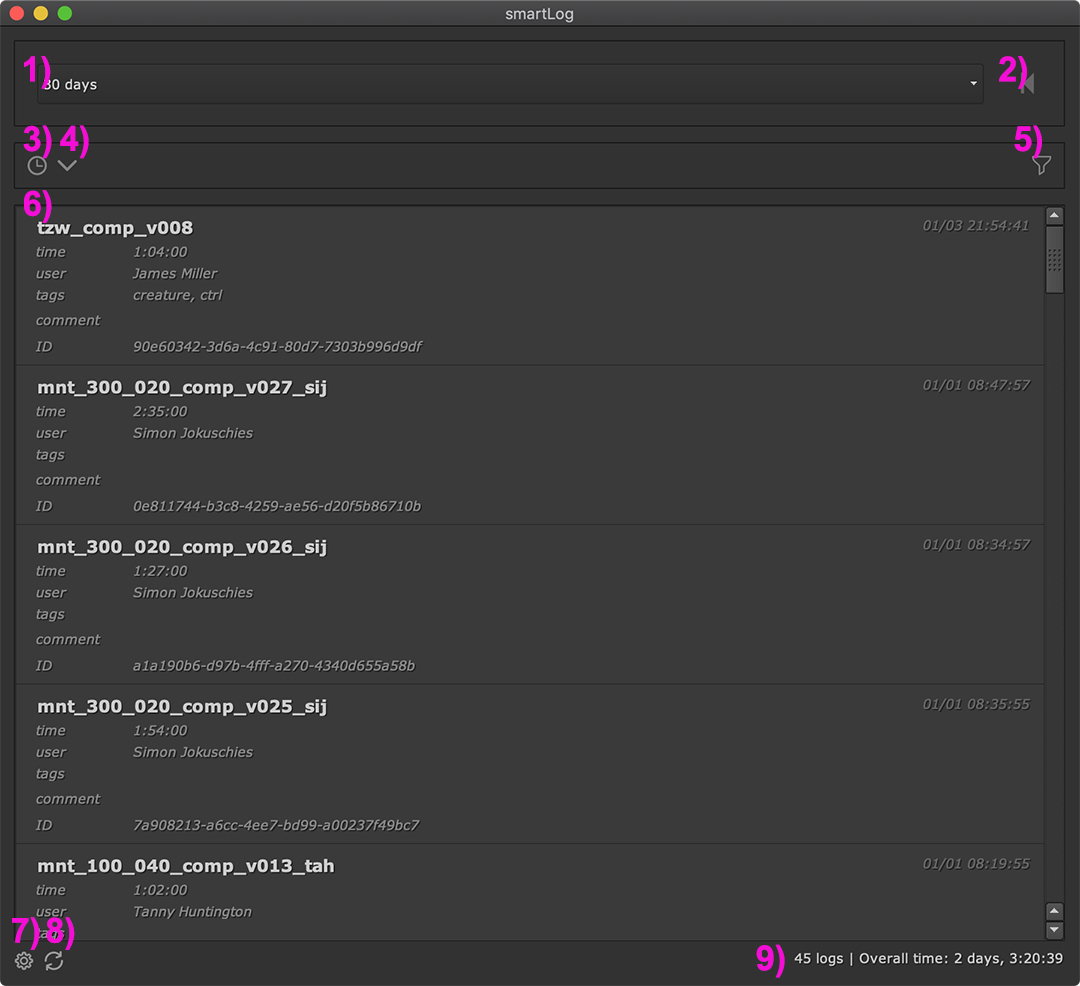
This mode contains the following elements:
- 1) Time frame: The time frame to view time logs for. Depending on the viewing mode this element changes.
- 2) Time range toggle: Click to toggle the time range modes.
- 3) View mode toggle: Click to toggle the viewing modes.
- 4) Sort toggle: Click to toggle the time logs in ascending/ descending order.
- 5) Filter: Click to toggle the filter section to filter logs after various criteria.
- 6) View: The time log view, at the moment being set to history mode.
- 7) Settings: Click to toggle the settings section.
- 8) Reload: Click to reload the view.
- 9) Info: Information about the current amount of logs and overall time of all logs.
Time range Toggle
The time range toggle at the top right as seen above (2) lets you choose between three different time range modes:
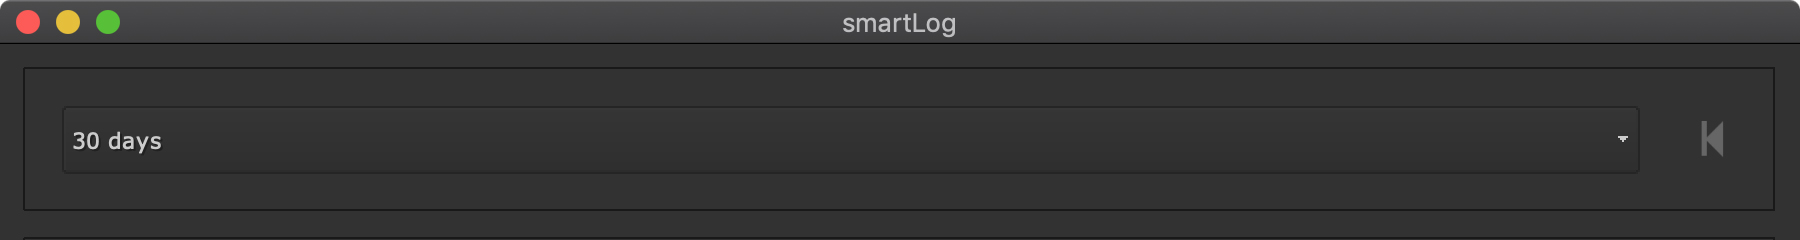
Latest Count: Use the drop down menu to show logs from the past X days.
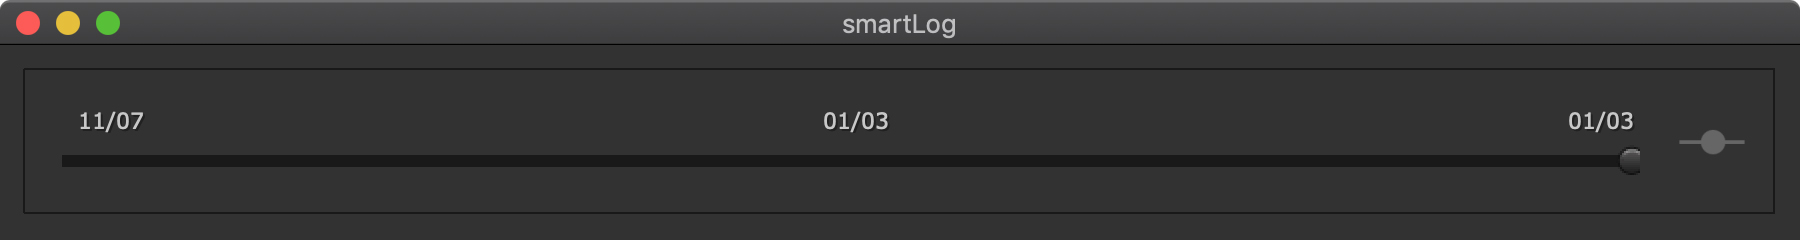
Single Day: Use the slider to show logs from one specific day.
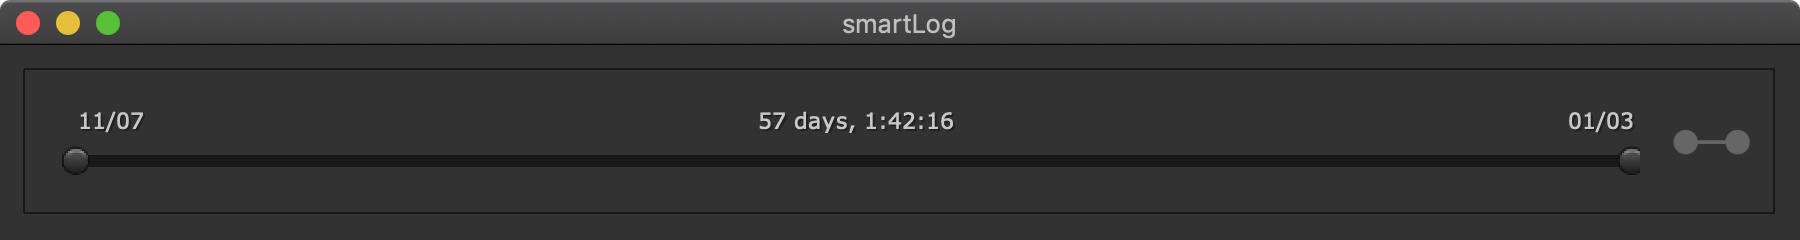
Day Range: Use the start and end slider to show logs for a specific range of days. Click and drag in the middle to shift start and end point.
View mode toggle
The view mode toggle as seen above (3) lets you choose between three different viewing modes:
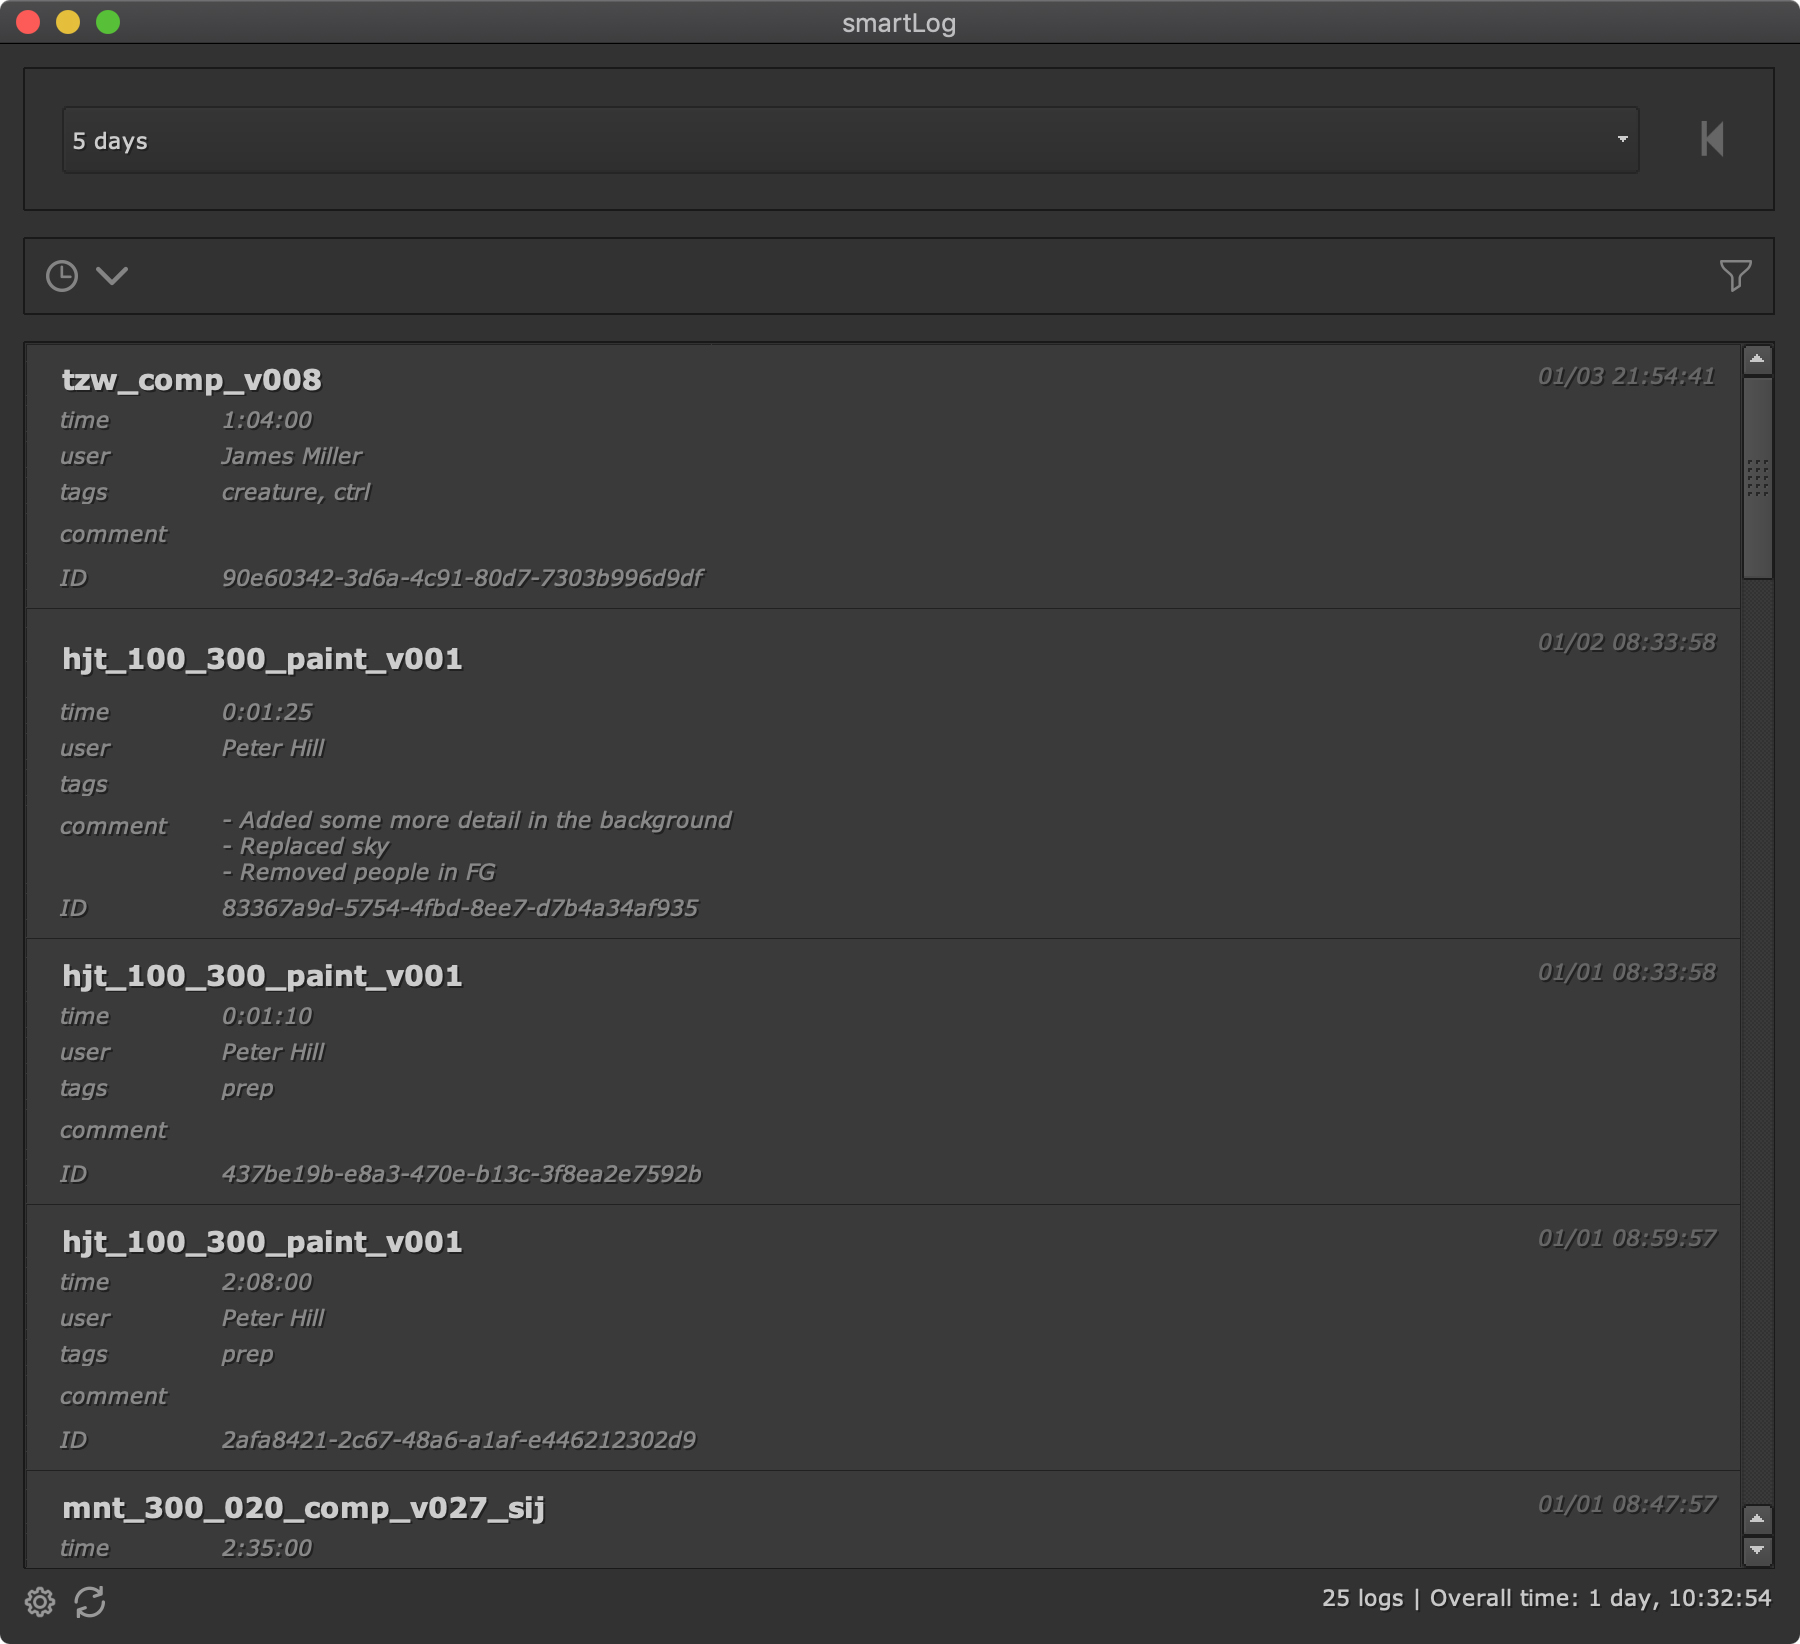
History: Shows time logs in chronological order. Provides context menu for all time logs.
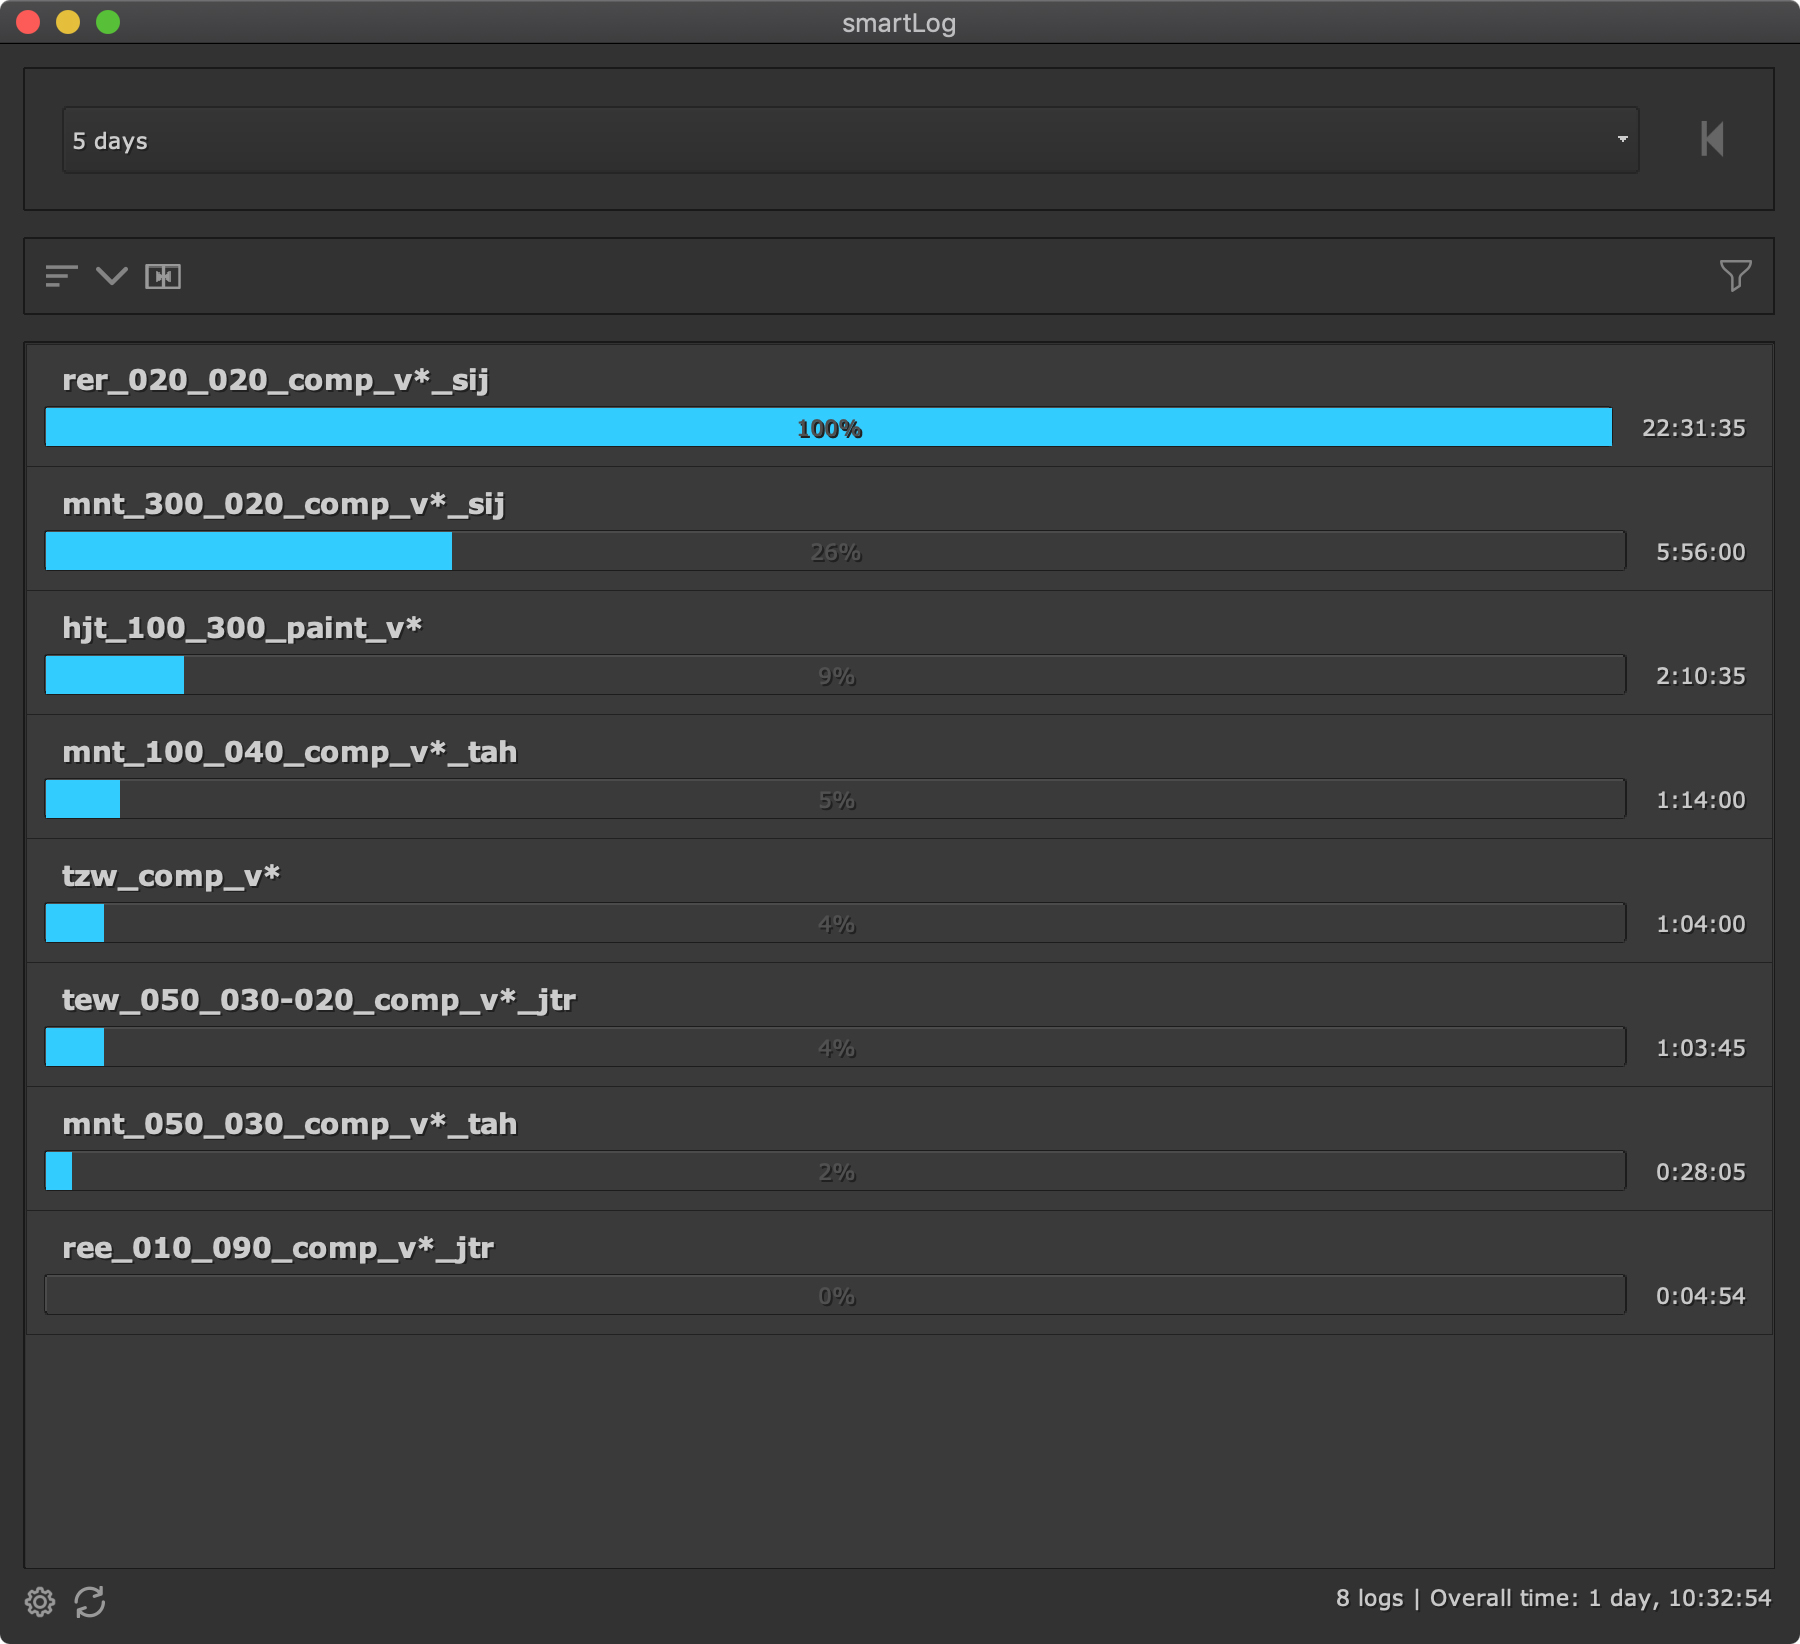
Time ranking: Shows the amount of time being spend compared to other working files displayed in a chart diagram.
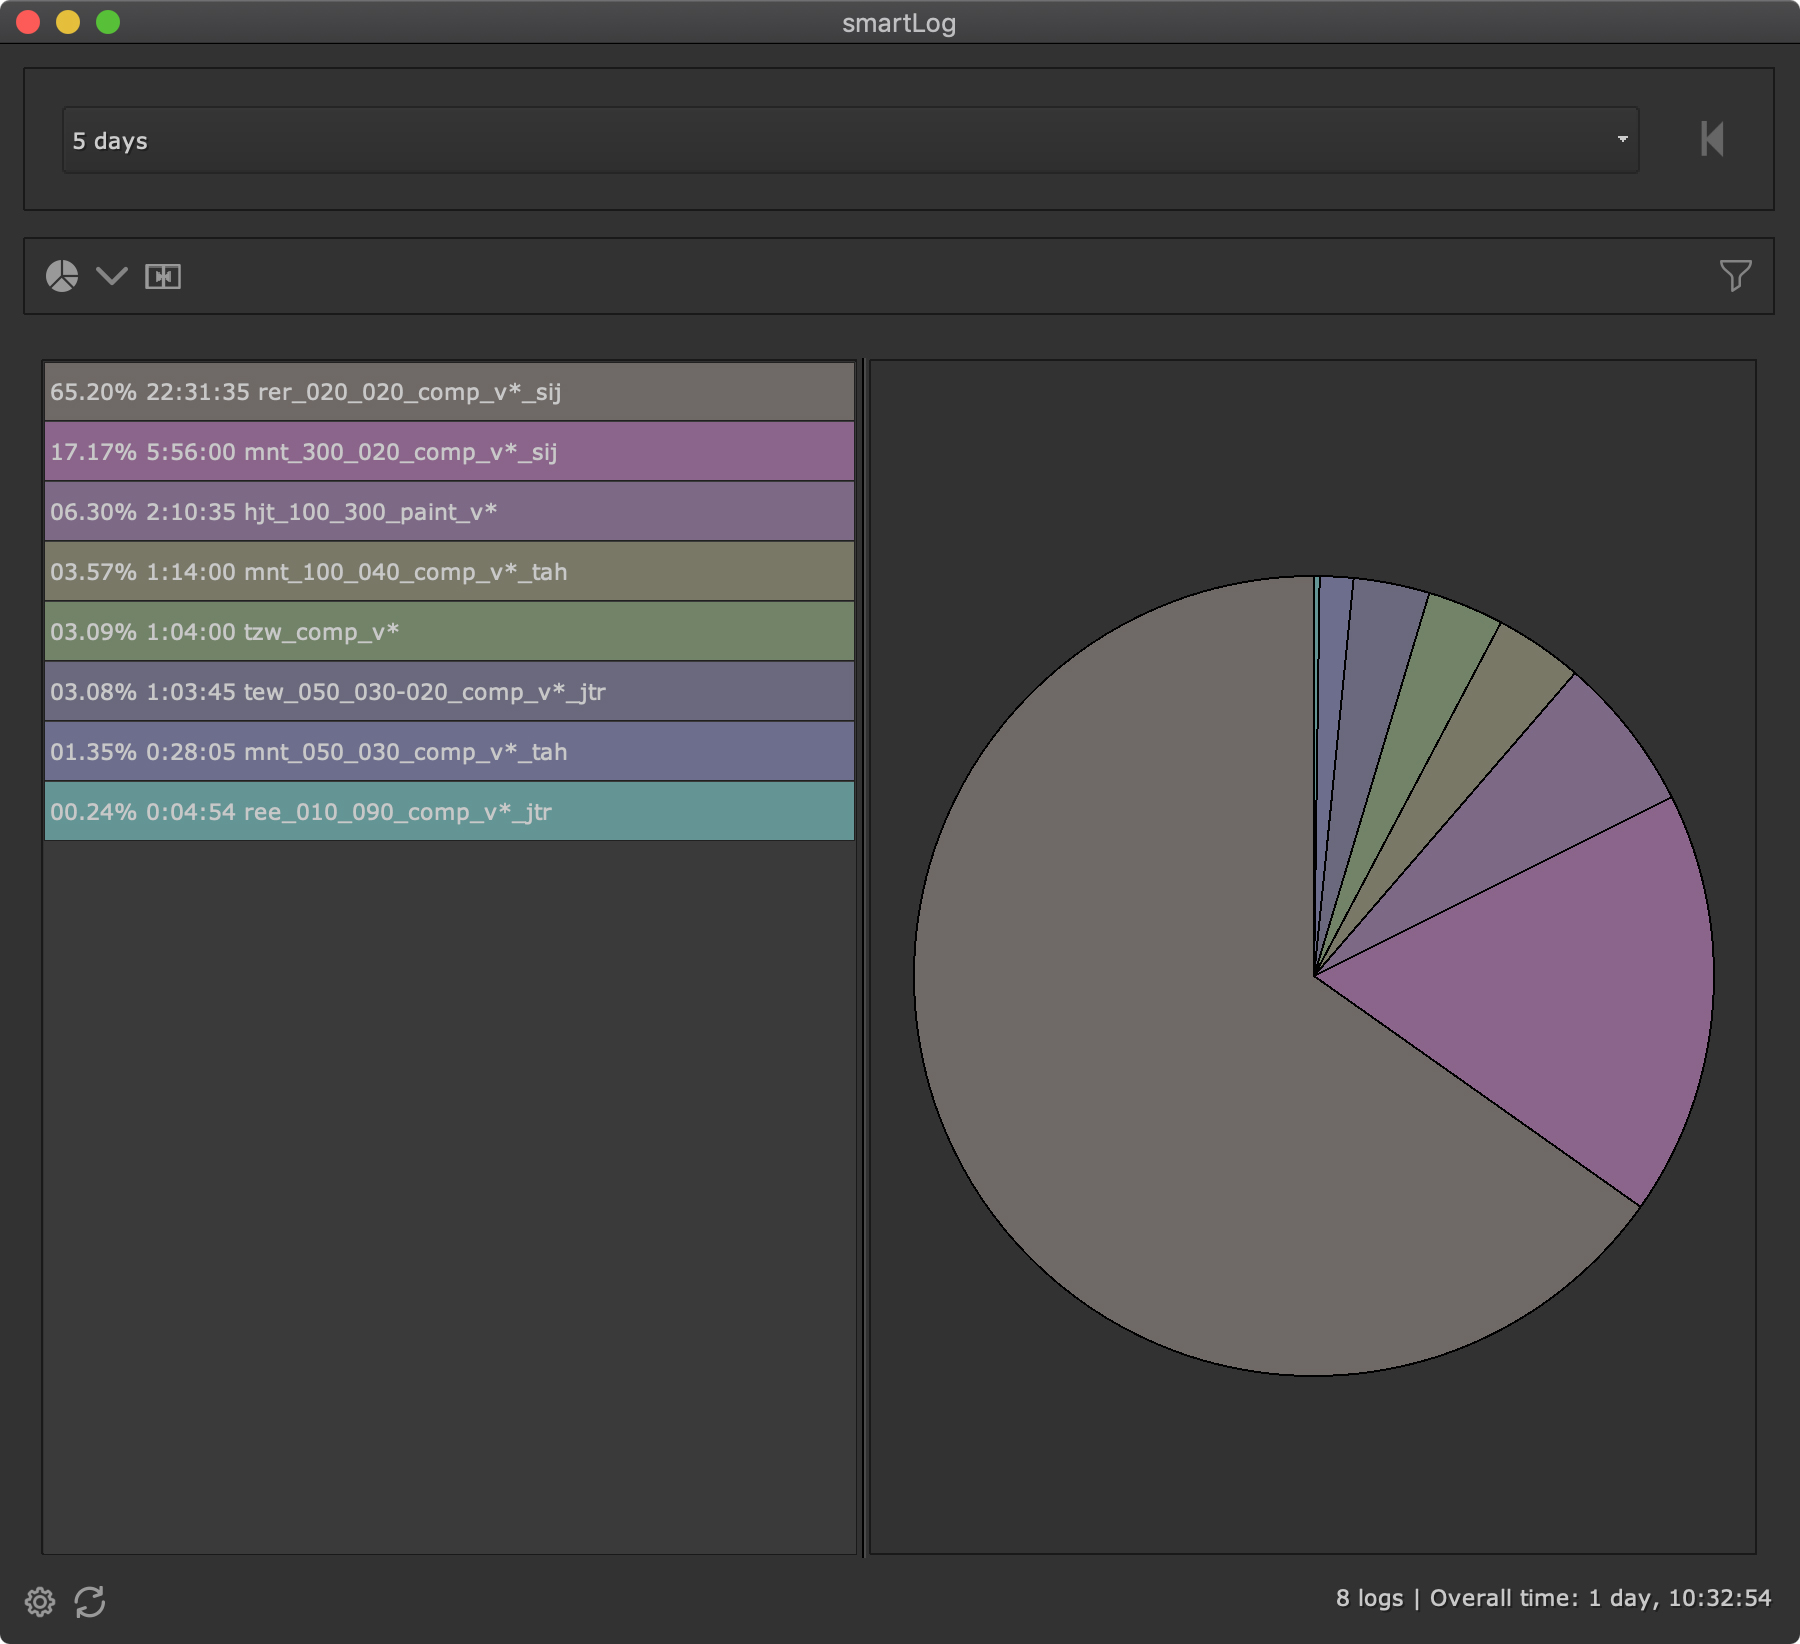
Time ranking: Shows the amount of time being spend compared to other working files displayed in a pie diagram.
Filtering time logs
You can filter logs in all viewing modes. To show the filter section, click the filter toggle at the right:
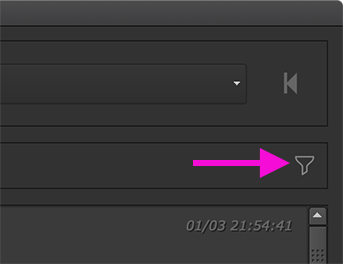
The filter section appears:
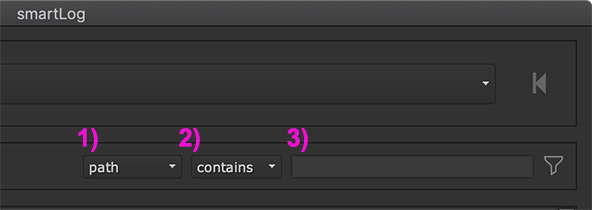
It contains the following elements:
- 1) Criteria: Set the criteria to search for. Choose between: Path, User, Tags, Comment, ID
- 2) Matching mode: Choose if the search value should just be contained in the log (loos search) or if it should match exactly (strict search).
- 3) Search term: The value to search for.
As soon as you enter anything into the search term (3) The view in the middle gets updated automatically, showing just the time logs that match your search filter.
Context menu (history mode)
When being in history mode, we can right click one or several time logs and choose various commands from the context menu:
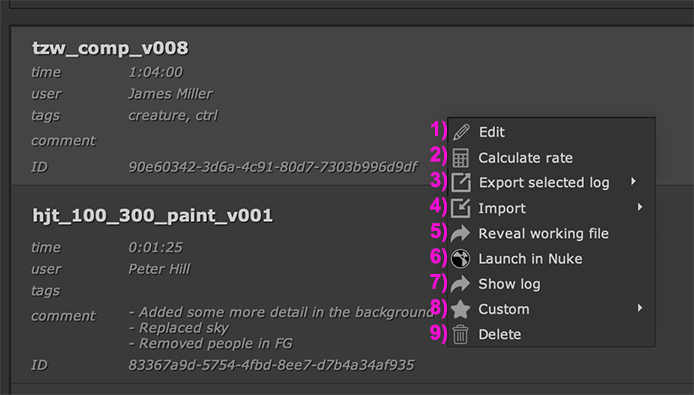
These are the following commands:
- 1) Edit: Edit the selected log. See the edit logs section for more information.
- 2) Calculate rate: Calculate day rates for the selected logs. See the Day rate calculator section for more information.
- 3) Export selected log: Export the selected logs in various formats. See the Exporting time logs section from our quickstart guide for more information.
- 4) Import: Import time logs into smartLog from various formats.
- 5) Reveal Working file: Reveal the working files that the selected time logs are associated with.
- 6) Launch in Nuke: Launch the working file that the selected time log is associated with in Nuke.
- 7) Show Log: Open the time log in a text editor.
- 8) Custom: Show custom commands to execute on selected logs. See custom commands for more information.
- 9) Delete: Delete the selected time logs.
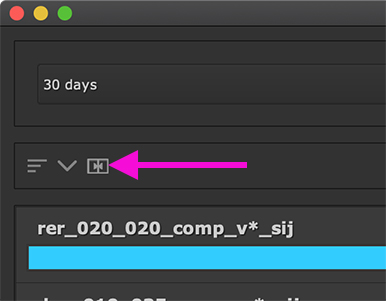
Merging and un-merging versions
In time ranking and pie viewing mode, we have the option to view time logs merged and unmerged. For that we can use the merge toggle at the top:
Merging time logs will merge the time being spent on a working file for all
time logs that follow the same pattern as defined in the settings
Substring ignore pattern field. Say, you have a working file called
Shot_010_comp_v001 and Shot_010_comp_v002. When merging is turned on,
the time being spend on the shot will be summed up.
The version itself gets displayed with a *:
However, if you prefer to get information about the time being spend on individual versions per working file, you can turn the merge toggle off:
By default, smartLog is set up to create an ignore pattern for the version and user abbreviation information of a working file. However, in the settings section, you can take over full control on the pattern and define it to your needs. For more information about defining custom substring ignore patterns, please have a look at the Substring ignore pattern section.
Exporting the current view (time ranking and pie view)
You can export the current state of the time ranking and pie view as csv file to disk. You can then send this data to your producer or process it further down the line if needed.
When being in time ranking or pie view mode, right click one of the rows in the table and choose Export view to csv. Choose a path to save to and the current state will be exported as csv. Crucial data like the total amount of logs, total time, sorting order, merged state, filter, etc. will be exported as well.
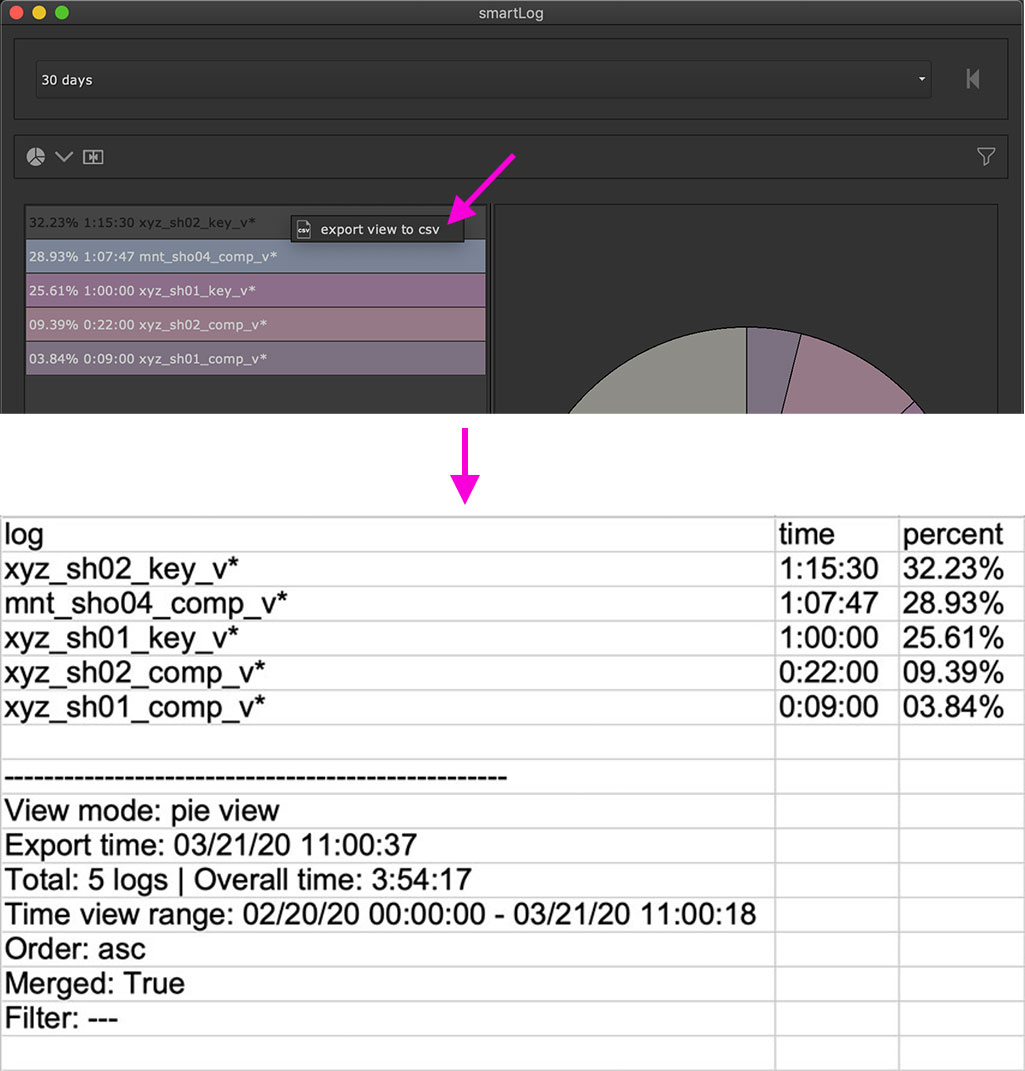
Exporting the current state of the pie view.
Exporting the current state of the time ranking view.